Target Information
| Target General Information | Top | |||||
|---|---|---|---|---|---|---|
| Target ID |
T51407
(Former ID: TTDNR00671)
|
|||||
| Target Name |
Exportin-1 (XPO1)
|
|||||
| Synonyms |
Exp1; Chromosome region maintenance 1 protein homolog; CRM1
Click to Show/Hide
|
|||||
| Gene Name |
XPO1
|
|||||
| Target Type |
Clinical trial target
|
[1] | ||||
| Disease | [+] 3 Target-related Diseases | + | ||||
| 1 | Liposarcoma [ICD-11: 2B59] | |||||
| 2 | Multiple myeloma [ICD-11: 2A83] | |||||
| 3 | Stomach cancer [ICD-11: 2B72] | |||||
| Function |
In the nucleus, in association with RANBP3, binds cooperatively to the NES on its target protein and to the GTPase RAN in its active GTP-bound form (Ran-GTP). Docking of this complex to the nuclear pore complex (NPC) is mediated through binding to nucleoporins. Upon transit of a nuclear export complex into the cytoplasm, disassembling of the complex and hydrolysis of Ran-GTP to Ran-GDP (induced by RANBP1 and RANGAP1, respectively) cause release of the cargo from the export receptor. The directionality of nuclear export is thought to be conferred by an asymmetric distribution of the GTP- and GDP-bound forms of Ran between the cytoplasm and nucleus. Involved in U3 snoRNA transport from Cajal bodies to nucleoli. Binds to late precursor U3 snoRNA bearing a TMG cap. Mediates the nuclear export of cellular proteins (cargos) bearing a leucine-rich nuclear export signal (NES) and of RNAs.
Click to Show/Hide
|
|||||
| BioChemical Class |
Eukaryotic nuclear pore complex
|
|||||
| UniProt ID | ||||||
| Sequence |
MPAIMTMLADHAARQLLDFSQKLDINLLDNVVNCLYHGEGAQQRMAQEVLTHLKEHPDAW
TRVDTILEFSQNMNTKYYGLQILENVIKTRWKILPRNQCEGIKKYVVGLIIKTSSDPTCV EKEKVYIGKLNMILVQILKQEWPKHWPTFISDIVGASRTSESLCQNNMVILKLLSEEVFD FSSGQITQVKSKHLKDSMCNEFSQIFQLCQFVMENSQNAPLVHATLETLLRFLNWIPLGY IFETKLISTLIYKFLNVPMFRNVSLKCLTEIAGVSVSQYEEQFVTLFTLTMMQLKQMLPL NTNIRLAYSNGKDDEQNFIQNLSLFLCTFLKEHDQLIEKRLNLRETLMEALHYMLLVSEV EETEIFKICLEYWNHLAAELYRESPFSTSASPLLSGSQHFDVPPRRQLYLPMLFKVRLLM VSRMAKPEEVLVVENDQGEVVREFMKDTDSINLYKNMRETLVYLTHLDYVDTERIMTEKL HNQVNGTEWSWKNLNTLCWAIGSISGAMHEEDEKRFLVTVIKDLLGLCEQKRGKDNKAII ASNIMYIVGQYPRFLRAHWKFLKTVVNKLFEFMHETHDGVQDMACDTFIKIAQKCRRHFV QVQVGEVMPFIDEILNNINTIICDLQPQQVHTFYEAVGYMIGAQTDQTVQEHLIEKYMLL PNQVWDSIIQQATKNVDILKDPETVKQLGSILKTNVRACKAVGHPFVIQLGRIYLDMLNV YKCLSENISAAIQANGEMVTKQPLIRSMRTVKRETLKLISGWVSRSNDPQMVAENFVPPL LDAVLIDYQRNVPAAREPEVLSTMAIIVNKLGGHITAEIPQIFDAVFECTLNMINKDFEE YPEHRTNFFLLLQAVNSHCFPAFLAIPPTQFKLVLDSIIWAFKHTMRNVADTGLQILFTL LQNVAQEEAAAQSFYQTYFCDILQHIFSVVTDTSHTAGLTMHASILAYMFNLVEEGKIST SLNPGNPVNNQIFLQEYVANLLKSAFPHLQDAQVKLFVTGLFSLNQDIPAFKEHLRDFLV QIKEFAGEDTSDLFLEEREIALRQADEEKHKRQMSVPGIFNPHEIPEEMCD Click to Show/Hide
|
|||||
| 3D Structure | Click to Show 3D Structure of This Target | PDB | ||||
| HIT2.0 ID | T57BCQ | |||||
| Drugs and Modes of Action | Top | |||||
|---|---|---|---|---|---|---|
| Clinical Trial Drug(s) | [+] 2 Clinical Trial Drugs | + | ||||
| 1 | Eltanexor oral | Drug Info | Phase 1/2 | Colorectal cancer | [2] | |
| 2 | SL-801 | Drug Info | Phase 1 | Solid tumour/cancer | [2] | |
| Mode of Action | [+] 1 Modes of Action | + | ||||
| Inhibitor | [+] 2 Inhibitor drugs | + | ||||
| 1 | Eltanexor oral | Drug Info | [2] | |||
| 2 | SL-801 | Drug Info | [2] | |||
| Cell-based Target Expression Variations | Top | |||||
|---|---|---|---|---|---|---|
| Cell-based Target Expression Variations | ||||||
| Drug Binding Sites of Target | Top | |||||
|---|---|---|---|---|---|---|
| Ligand Name: (2E,5S,6R,7S,9R,10E,12E,15R,16Z,18E,20R,21S)-17-ethyl-6,20-dihydroxy-3,5,7,9,11,15,21-heptamethyl-8-oxotetracosa-2,10,12,16,18-pentaenedioic acid | Ligand Info | |||||
| Structure Description | Human CRM1-RanGTP in complex with Leptomycin B | PDB:6TVO | ||||
| Method | X-ray diffraction | Resolution | 3.20 Å | Mutation | Yes | [6] |
| PDB Sequence |
LADHAARQLL
17 DFSQKLDINL27 LDNVVNCLYH37 GEGAQQRMAQ47 EVLTHLKEHP57 DAWTRVDTIL 67 EFSQNMNTKY77 YGLQILENVI87 KTRWKILPRN97 QCEGIKKYVV107 GLIIKTSSDP 117 TCVEKEKVYI127 GKLNMILVQI137 LKQEWPKHWP147 TFISDIVGAS157 RTSESLCQNN 167 MVILKLLSEE177 VFDFSSGQIT187 QVKSKHLKDS197 MCNEFSQIFQ207 LCQFVMENSQ 217 NAPLVHATLE227 TLLRFLNWIP237 LGYIFETKLI247 STLIYKFLNV257 PMFRNVSLKC 267 LTEIAGVSVS277 QYEEQFVTLF287 TLTMMQLKQM297 LPLNTNIRLA307 YSNGKDDEQN 317 FIQNLSLFLC327 TFLKEHDQLI337 EKRLNLRETL347 MEALHYMLLV357 SEVEETEIFK 367 ICLEYWNHLA377 AELYRESPFS387 TVPPRRQLYL410 PMLFKVRLLM420 VSRMAKPEEA 430 AAVENDQGEV440 VREFMKDTDS450 INLYKNMRET460 LVYLTHLDYV470 DTERIMTEKL 480 HNQVNGTEWS490 WKNLNTLCWA500 IGSISGAMHE510 EDEKRFLVTV520 IKDLLGLCEQ 530 KRGKDNKAII540 ASNIMYIVGQ550 YPRFLRAHWK560 FLKTVVNKLF570 EFMHETHDGV 580 QDMACDTFIK590 IAQKCRRHFV600 QVQVGEVMPF610 IDEILNNINT620 IICDLQPQQV 630 HTFYEAVGYM640 IGAQTDQTVQ650 EHLIEKYMLL660 PNQVWDSIIQ670 QATKNVDILK 680 DPETVKQLGS690 ILKTNVRACK700 AVGHPFVIQL710 GRIYLDMLNV720 YKCLSENISA 730 AIQANGEMVT740 KQPLIRSMRT750 VKRETLKLIS760 GWVSRSNDPQ770 MVAENFVPPL 780 LDAVLIDYQR790 NVPAAREPEV800 LSTMAIIVNK810 LGGHITAEIP820 QIFDAVFECT 830 LNMINKDFEE840 YPEHRTNFFL850 LLQAVNSHCF860 PAFLAIPPTQ870 FKLVLDSIIW 880 AFKHTMRNVA890 DTGLQILFTL900 LQNVAQEEAA910 AQSFYQTYFC920 DILQHIFSVV 930 TDTSHTAGLT940 MHASILAYMF950 NLVEEGKIST960 SLNPGNPVNN970 QIFLQEYVAN 980 LLKSAFPHLQ990 DAQVKLFVTG1000 LFSLNQDIPA1010 FKEHLRDFLV1020 QIKEFAGEDT 1030 S
|
|||||
|
|
LYS514
2.644
VAL518
4.271
ILE521
3.702
LYS522
3.684
LEU525
3.666
CYS528
1.768
GLU529
3.679
LYS537
2.685
ILE540
4.400
ALA541
3.433
ILE544
4.018
|
|||||
| Click to View More Binding Site Information of This Target with Different Ligands | ||||||
| Different Human System Profiles of Target | Top |
|---|---|
|
Human Similarity Proteins
of target is determined by comparing the sequence similarity of all human proteins with the target based on BLAST. The similarity proteins for a target are defined as the proteins with E-value < 0.005 and outside the protein families of the target.
A target that has fewer human similarity proteins outside its family is commonly regarded to possess a greater capacity to avoid undesired interactions and thus increase the possibility of finding successful drugs
(Brief Bioinform, 21: 649-662, 2020).
Human Tissue Distribution
of target is determined from a proteomics study that quantified more than 12,000 genes across 32 normal human tissues. Tissue Specificity (TS) score was used to define the enrichment of target across tissues.
The distribution of targets among different tissues or organs need to be taken into consideration when assessing the target druggability, as it is generally accepted that the wider the target distribution, the greater the concern over potential adverse effects
(Nat Rev Drug Discov, 20: 64-81, 2021).
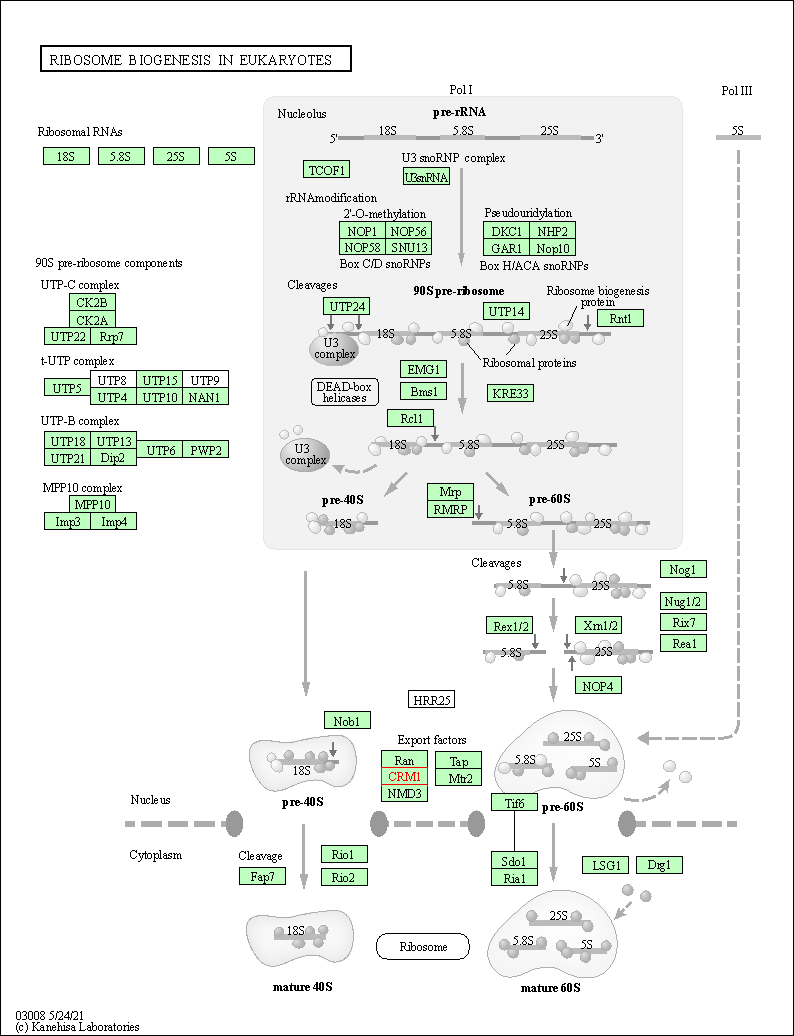
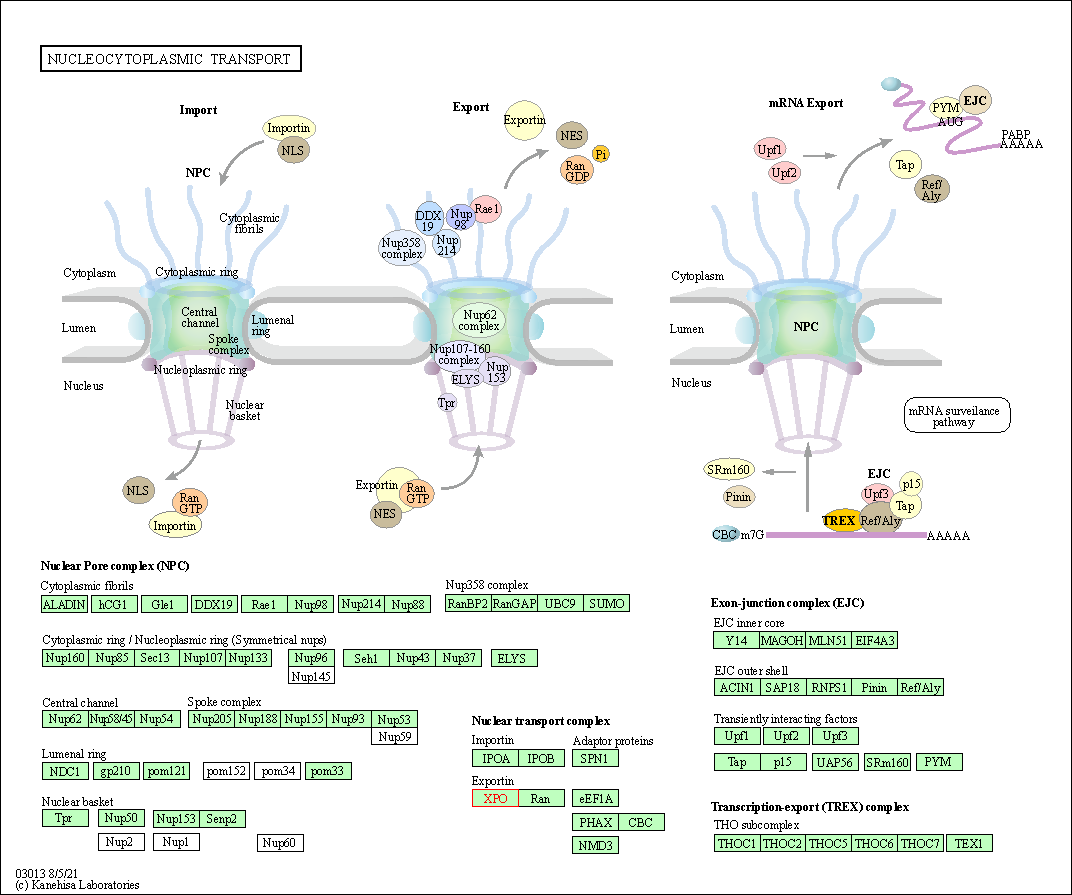
Human Pathway Affiliation
of target is determined by the life-essential pathways provided on KEGG database. The target-affiliated pathways were defined based on the following two criteria (a) the pathways of the studied target should be life-essential for both healthy individuals and patients, and (b) the studied target should occupy an upstream position in the pathways and therefore had the ability to regulate biological function.
Targets involved in a fewer pathways have greater likelihood to be successfully developed, while those associated with more human pathways increase the chance of undesirable interferences with other human processes
(Pharmacol Rev, 58: 259-279, 2006).
Biological Network Descriptors
of target is determined based on a human protein-protein interactions (PPI) network consisting of 9,309 proteins and 52,713 PPIs, which were with a high confidence score of ≥ 0.95 collected from STRING database.
The network properties of targets based on protein-protein interactions (PPIs) have been widely adopted for the assessment of target’s druggability. Proteins with high node degree tend to have a high impact on network function through multiple interactions, while proteins with high betweenness centrality are regarded to be central for communication in interaction networks and regulate the flow of signaling information
(Front Pharmacol, 9, 1245, 2018;
Curr Opin Struct Biol. 44:134-142, 2017).
Human Similarity Proteins
Human Tissue Distribution
Human Pathway Affiliation
Biological Network Descriptors
|
|
|
There is no similarity protein (E value < 0.005) for this target
|
|
Note:
If a protein has TS (tissue specficity) scores at least in one tissue >= 2.5, this protein is called tissue-enriched (including tissue-enriched-but-not-specific and tissue-specific). In the plots, the vertical lines are at thresholds 2.5 and 4.
|
| KEGG Pathway | Pathway ID | Affiliated Target | Pathway Map |
|---|---|---|---|
| Ribosome biogenesis in eukaryotes | hsa03008 | Affiliated Target |

|
| Class: Genetic Information Processing => Translation | Pathway Hierarchy | ||
| Nucleocytoplasmic transport | hsa03013 | Affiliated Target |

|
| Class: Genetic Information Processing => Translation | Pathway Hierarchy | ||
| Viral life cycle - HIV-1 | hsa03250 | Affiliated Target |

|
| Class: Genetic Information Processing => Information processing in viruses | Pathway Hierarchy | ||
| Degree | 34 | Degree centrality | 3.65E-03 | Betweenness centrality | 3.91E-03 |
|---|---|---|---|---|---|
| Closeness centrality | 2.58E-01 | Radiality | 1.45E+01 | Clustering coefficient | 1.55E-01 |
| Neighborhood connectivity | 4.80E+01 | Topological coefficient | 5.23E-02 | Eccentricity | 11 |
| Download | Click to Download the Full PPI Network of This Target | ||||
| Chemical Structure based Activity Landscape of Target | Top |
|---|---|
| Drug Property Profile of Target | Top | |
|---|---|---|
| (1) Molecular Weight (mw) based Drug Clustering | (2) Octanol/Water Partition Coefficient (xlogp) based Drug Clustering | |
|
|
||
| (3) Hydrogen Bond Donor Count (hbonddonor) based Drug Clustering | (4) Hydrogen Bond Acceptor Count (hbondacc) based Drug Clustering | |
|
|
||
| (5) Rotatable Bond Count (rotbonds) based Drug Clustering | (6) Topological Polar Surface Area (polararea) based Drug Clustering | |
|
|
||
| "RO5" indicates the cutoff set by lipinski's rule of five; "D123AB" colored in GREEN denotes the no violation of any cutoff in lipinski's rule of five; "D123AB" colored in PURPLE refers to the violation of only one cutoff in lipinski's rule of five; "D123AB" colored in BLACK represents the violation of more than one cutoffs in lipinski's rule of five | ||
| Target Regulators | Top | |||||
|---|---|---|---|---|---|---|
| Target-interacting Proteins | ||||||
| Target Profiles in Patients | Top | |||||
|---|---|---|---|---|---|---|
| Drug Resistance Mutation (DRM) | ||||||
| References | Top | |||||
|---|---|---|---|---|---|---|
| REF 1 | Inhibition of CRM1-dependent nuclear export sensitizes malignant cells to cytotoxic and targeted agents. Semin Cancer Biol. 2014 August; 0: 62-73. | |||||
| REF 2 | Clinical pipeline report, company report or official report of the Pharmaceutical Research and Manufacturers of America (PhRMA) | |||||
| REF 3 | Clinical pipeline report, company report or official report of the Pharmaceutical Research and Manufacturers of America (PhRMA) | |||||
| REF 4 | Clinical pipeline report, company report or official report of the Pharmaceutical Research and Manufacturers of America (PhRMA) | |||||
| REF 5 | Trusted, scientifically sound profiles of drug programs, clinical trials, safety reports, and company deals, written by scientists. Springer. 2015. Adis Insight (drug id 800024269) | |||||
| REF 6 | Characterization of Inhibition Reveals Distinctive Properties for Human and Saccharomyces cerevisiae CRM1. J Med Chem. 2020 Jul 23;63(14):7545-7558. | |||||
If You Find Any Error in Data or Bug in Web Service, Please Kindly Report It to Dr. Zhou and Dr. Zhang.

