Target Information
| Target General Information | Top | |||||
|---|---|---|---|---|---|---|
| Target ID |
T67102
(Former ID: TTDR00447)
|
|||||
| Target Name |
Cathepsin D (CTSD)
|
|||||
| Synonyms |
CPSD; CD
Click to Show/Hide
|
|||||
| Gene Name |
CTSD
|
|||||
| Target Type |
Clinical trial target
|
[1] | ||||
| Disease | [+] 1 Target-related Diseases | + | ||||
| 1 | Multiple sclerosis [ICD-11: 8A40] | |||||
| Function |
Plays a role in APP processing following cleavage and activation by ADAM30 which leads to APP degradation. Involved in the pathogenesis of several diseases such as breast cancer and possibly Alzheimer disease. Acid protease active in intracellular protein breakdown.
Click to Show/Hide
|
|||||
| BioChemical Class |
Peptidase
|
|||||
| UniProt ID | ||||||
| EC Number |
EC 3.4.23.5
|
|||||
| Sequence |
MQPSSLLPLALCLLAAPASALVRIPLHKFTSIRRTMSEVGGSVEDLIAKGPVSKYSQAVP
AVTEGPIPEVLKNYMDAQYYGEIGIGTPPQCFTVVFDTGSSNLWVPSIHCKLLDIACWIH HKYNSDKSSTYVKNGTSFDIHYGSGSLSGYLSQDTVSVPCQSASSASALGGVKVERQVFG EATKQPGITFIAAKFDGILGMAYPRISVNNVLPVFDNLMQQKLVDQNIFSFYLSRDPDAQ PGGELMLGGTDSKYYKGSLSYLNVTRKAYWQVHLDQVEVASGLTLCKEGCEAIVDTGTSL MVGPVDEVRELQKAIGAVPLIQGEYMIPCEKVSTLPAITLKLGGKGYKLSPEDYTLKVSQ AGKTLCLSGFMGMDIPPPSGPLWILGDVFIGRYYTVFDRDNNRVGFAEAARL Click to Show/Hide
|
|||||
| 3D Structure | Click to Show 3D Structure of This Target | AlphaFold | ||||
| HIT2.0 ID | T23WMS | |||||
| Drugs and Modes of Action | Top | |||||
|---|---|---|---|---|---|---|
| Clinical Trial Drug(s) | [+] 1 Clinical Trial Drugs | + | ||||
| 1 | PMID10498202C1 | Drug Info | Clinical trial | Multiple sclerosis | [1], [2] | |
| Discontinued Drug(s) | [+] 1 Discontinued Drugs | + | ||||
| 1 | CI-992 | Drug Info | Terminated | Hypertension | [3] | |
| Mode of Action | [+] 1 Modes of Action | + | ||||
| Inhibitor | [+] 9 Inhibitor drugs | + | ||||
| 1 | PMID10498202C1 | Drug Info | [1] | |||
| 2 | CI-992 | Drug Info | [4] | |||
| 3 | Alpha-D-Mannose | Drug Info | [5] | |||
| 4 | Carbocyclic Peptidomimetic | Drug Info | [6] | |||
| 5 | GRL-7234 | Drug Info | [7] | |||
| 6 | KNI-10006 | Drug Info | [8] | |||
| 7 | N-Aminoethylmorpholine | Drug Info | [5] | |||
| 8 | PMID8410973C3 | Drug Info | [9] | |||
| 9 | S-Methylcysteine | Drug Info | [5] | |||
| Cell-based Target Expression Variations | Top | |||||
|---|---|---|---|---|---|---|
| Cell-based Target Expression Variations | ||||||
| Drug Binding Sites of Target | Top | |||||
|---|---|---|---|---|---|---|
| Ligand Name: PMID10498202C1 | Ligand Info | |||||
| Structure Description | Structure of Cathepsin D with inhibitor 2-bromo-N-[(2S,3S)-4-{[2-(2,4-dichlorophenyl)ethyl][3-(1,3-dioxo-1,3-dihydro-2H-isoindol-2-yl)propanoyl]amino}-3-hydroxy-1-(3-phenoxyphenyl)butan-2-yl]-4,5-dimethoxybenzamide | PDB:4OC6 | ||||
| Method | X-ray diffraction | Resolution | 2.64 Å | Mutation | No | [10] |
| PDB Sequence |
> Chain A
GPIPEVLKNY 10 MDAQYYGEIG20 IGTPPQCFTV30 VFDTGSSNLW40 VPSIHCKLLD50 IACWIHHKYN 60 SDKSSTYVKN70 GTSFDIHYGS80 GSLSGYLSQD90 TVSVPCQS> Chain B GGVKVERQVF 115 GEATKQPGIT125 FIAAKFDGIL135 GMAYPRISVN145 NVLPVFDNLM155 QQKLVDQNIF 165 SFYLSRDPDA175 QPGGELMLGG185 TDSKYYKGSL195 SYLNVTRKAY205 WQVHLDQVEV 215 ASGLTLCKEG225 CEAIVDTGTS235 LMVGPVDEVR245 ELQKAIGAVP255 LIQGEYMIPC 265 EKVSTLPAIT275 LKLGGKGYKL285 SPEDYTLKVS295 QAGKTLCLSG305 FMGMDIPPPS 315 GPLWILGDVF325 IGRYYTVFDR335 DNNRVGFAEA345 ARL
|
|||||
|
|
ALA13[A]
3.315
GLN14[A]
4.058
ASP33[A]
2.653
GLY35[A]
3.177
SER36[A]
3.884
SER37[A]
4.931
HIS77[A]
3.397
TYR78[A]
3.118
GLY79[A]
2.763
SER80[A]
2.653
THR125[B]
3.395
PHE126[B]
4.050
ALA128[B]
3.959
ALA129[B]
3.766
PHE131[B]
3.502
ILE134[B]
3.717
|
|||||
| Ligand Name: N-(3,4-Dimethoxybenzyl)-Nalpha-{n-[(3,4-Dimethoxyphenyl)acetyl]carbamimidoyl}-D-Phenylalaninamide | Ligand Info | |||||
| Structure Description | Structure of Cathepsin D with inhibitor N-(3,4-dimethoxybenzyl)-Nalpha-{N-[(3,4-dimethoxyphenyl)acetyl]carbamimidoyl}-D-phenylalaninamide | PDB:4OD9 | ||||
| Method | X-ray diffraction | Resolution | 1.90 Å | Mutation | No | [10] |
| PDB Sequence |
> Chain A
PIPEVLKNYM 11 DAQYYGEIGI21 GTPPQCFTVV31 FDTGSSNLWV41 PSIHCKLLDI51 ACWIHHKYNS 61 DKSSTYVKNG71 TSFDIHYGSG81 SLSGYLSQDT91 VSVPCQS> Chain B GVKVERQVFG 116 EATKQPGITF126 IAAKFDGILG136 MAYPRISVNN146 VLPVFDNLMQ156 QKLVDQNIFS 166 FYLSRDPDAQ176 PGGELMLGGT186 DSKYYKGSLS196 YLNVTRKAYW206 QVHLDQVEVA 216 SGLTLCKEGC226 EAIVDTGTSL236 MVGPVDEVRE246 LQKAIGAVPL256 IQGEYMIPCE 266 KVSTLPAITL276 KLGGKGYKLS286 PEDYTLKVSQ296 AGKTLCLSGF306 MGMDIPPPSG 316 PLWILGDVFI326 GRYYTVFDRD336 NNRVGFAEAA346
|
|||||
|
|
ALA13[A]
3.560
GLN14[A]
4.004
VAL31[A]
4.463
ASP33[A]
2.701
GLY35[A]
3.560
SER36[A]
4.360
TYR78[A]
3.403
GLY79[A]
3.028
SER80[A]
3.580
THR125[B]
3.440
PHE126[B]
3.636
ALA129[B]
4.080
PHE131[B]
3.403
ILE134[B]
3.676
TYR205[B]
3.655
|
|||||
| Click to View More Binding Site Information of This Target with Different Ligands | ||||||
| Different Human System Profiles of Target | Top |
|---|---|
|
Human Similarity Proteins
of target is determined by comparing the sequence similarity of all human proteins with the target based on BLAST. The similarity proteins for a target are defined as the proteins with E-value < 0.005 and outside the protein families of the target.
A target that has fewer human similarity proteins outside its family is commonly regarded to possess a greater capacity to avoid undesired interactions and thus increase the possibility of finding successful drugs
(Brief Bioinform, 21: 649-662, 2020).
Human Tissue Distribution
of target is determined from a proteomics study that quantified more than 12,000 genes across 32 normal human tissues. Tissue Specificity (TS) score was used to define the enrichment of target across tissues.
The distribution of targets among different tissues or organs need to be taken into consideration when assessing the target druggability, as it is generally accepted that the wider the target distribution, the greater the concern over potential adverse effects
(Nat Rev Drug Discov, 20: 64-81, 2021).
Human Pathway Affiliation
of target is determined by the life-essential pathways provided on KEGG database. The target-affiliated pathways were defined based on the following two criteria (a) the pathways of the studied target should be life-essential for both healthy individuals and patients, and (b) the studied target should occupy an upstream position in the pathways and therefore had the ability to regulate biological function.
Targets involved in a fewer pathways have greater likelihood to be successfully developed, while those associated with more human pathways increase the chance of undesirable interferences with other human processes
(Pharmacol Rev, 58: 259-279, 2006).
Biological Network Descriptors
of target is determined based on a human protein-protein interactions (PPI) network consisting of 9,309 proteins and 52,713 PPIs, which were with a high confidence score of ≥ 0.95 collected from STRING database.
The network properties of targets based on protein-protein interactions (PPIs) have been widely adopted for the assessment of target’s druggability. Proteins with high node degree tend to have a high impact on network function through multiple interactions, while proteins with high betweenness centrality are regarded to be central for communication in interaction networks and regulate the flow of signaling information
(Front Pharmacol, 9, 1245, 2018;
Curr Opin Struct Biol. 44:134-142, 2017).
Human Similarity Proteins
Human Tissue Distribution
Human Pathway Affiliation
Biological Network Descriptors
|
|
|
There is no similarity protein (E value < 0.005) for this target
|
|
Note:
If a protein has TS (tissue specficity) scores at least in one tissue >= 2.5, this protein is called tissue-enriched (including tissue-enriched-but-not-specific and tissue-specific). In the plots, the vertical lines are at thresholds 2.5 and 4.
|
| KEGG Pathway | Pathway ID | Affiliated Target | Pathway Map |
|---|---|---|---|
| Sphingolipid signaling pathway | hsa04071 | Affiliated Target |
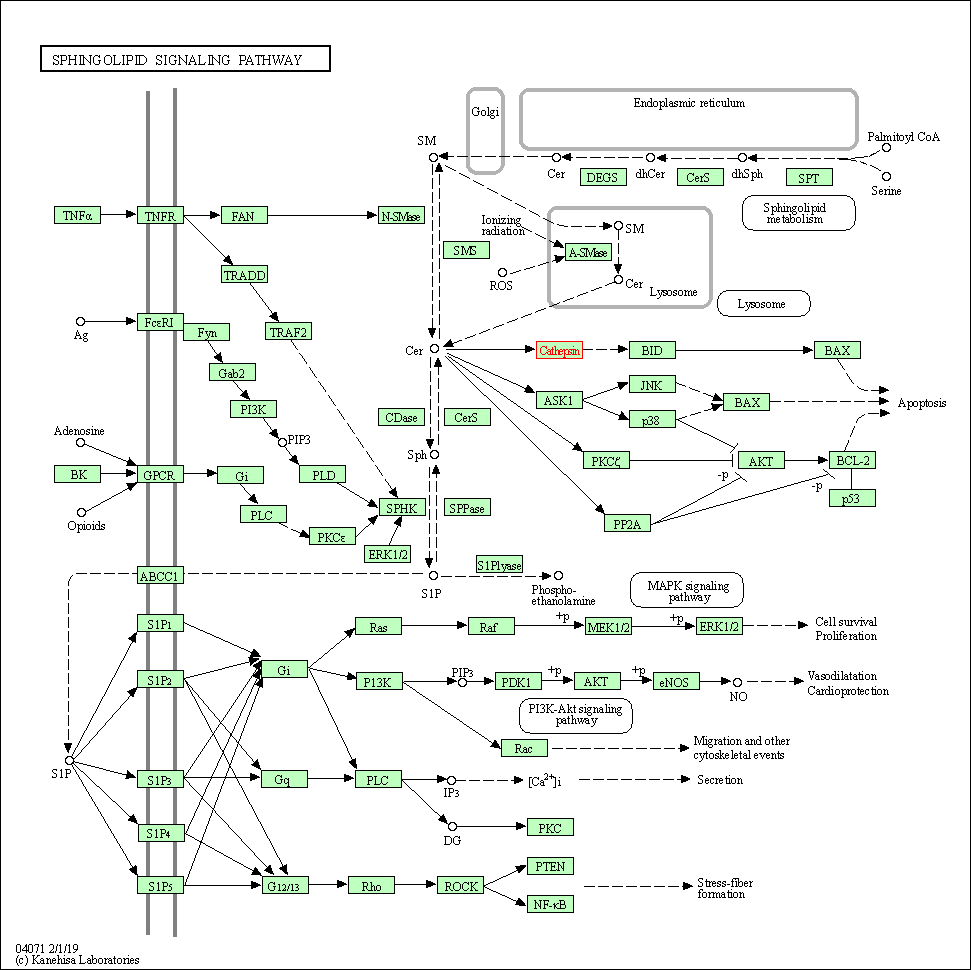
|
| Class: Environmental Information Processing => Signal transduction | Pathway Hierarchy | ||
| Autophagy - animal | hsa04140 | Affiliated Target |
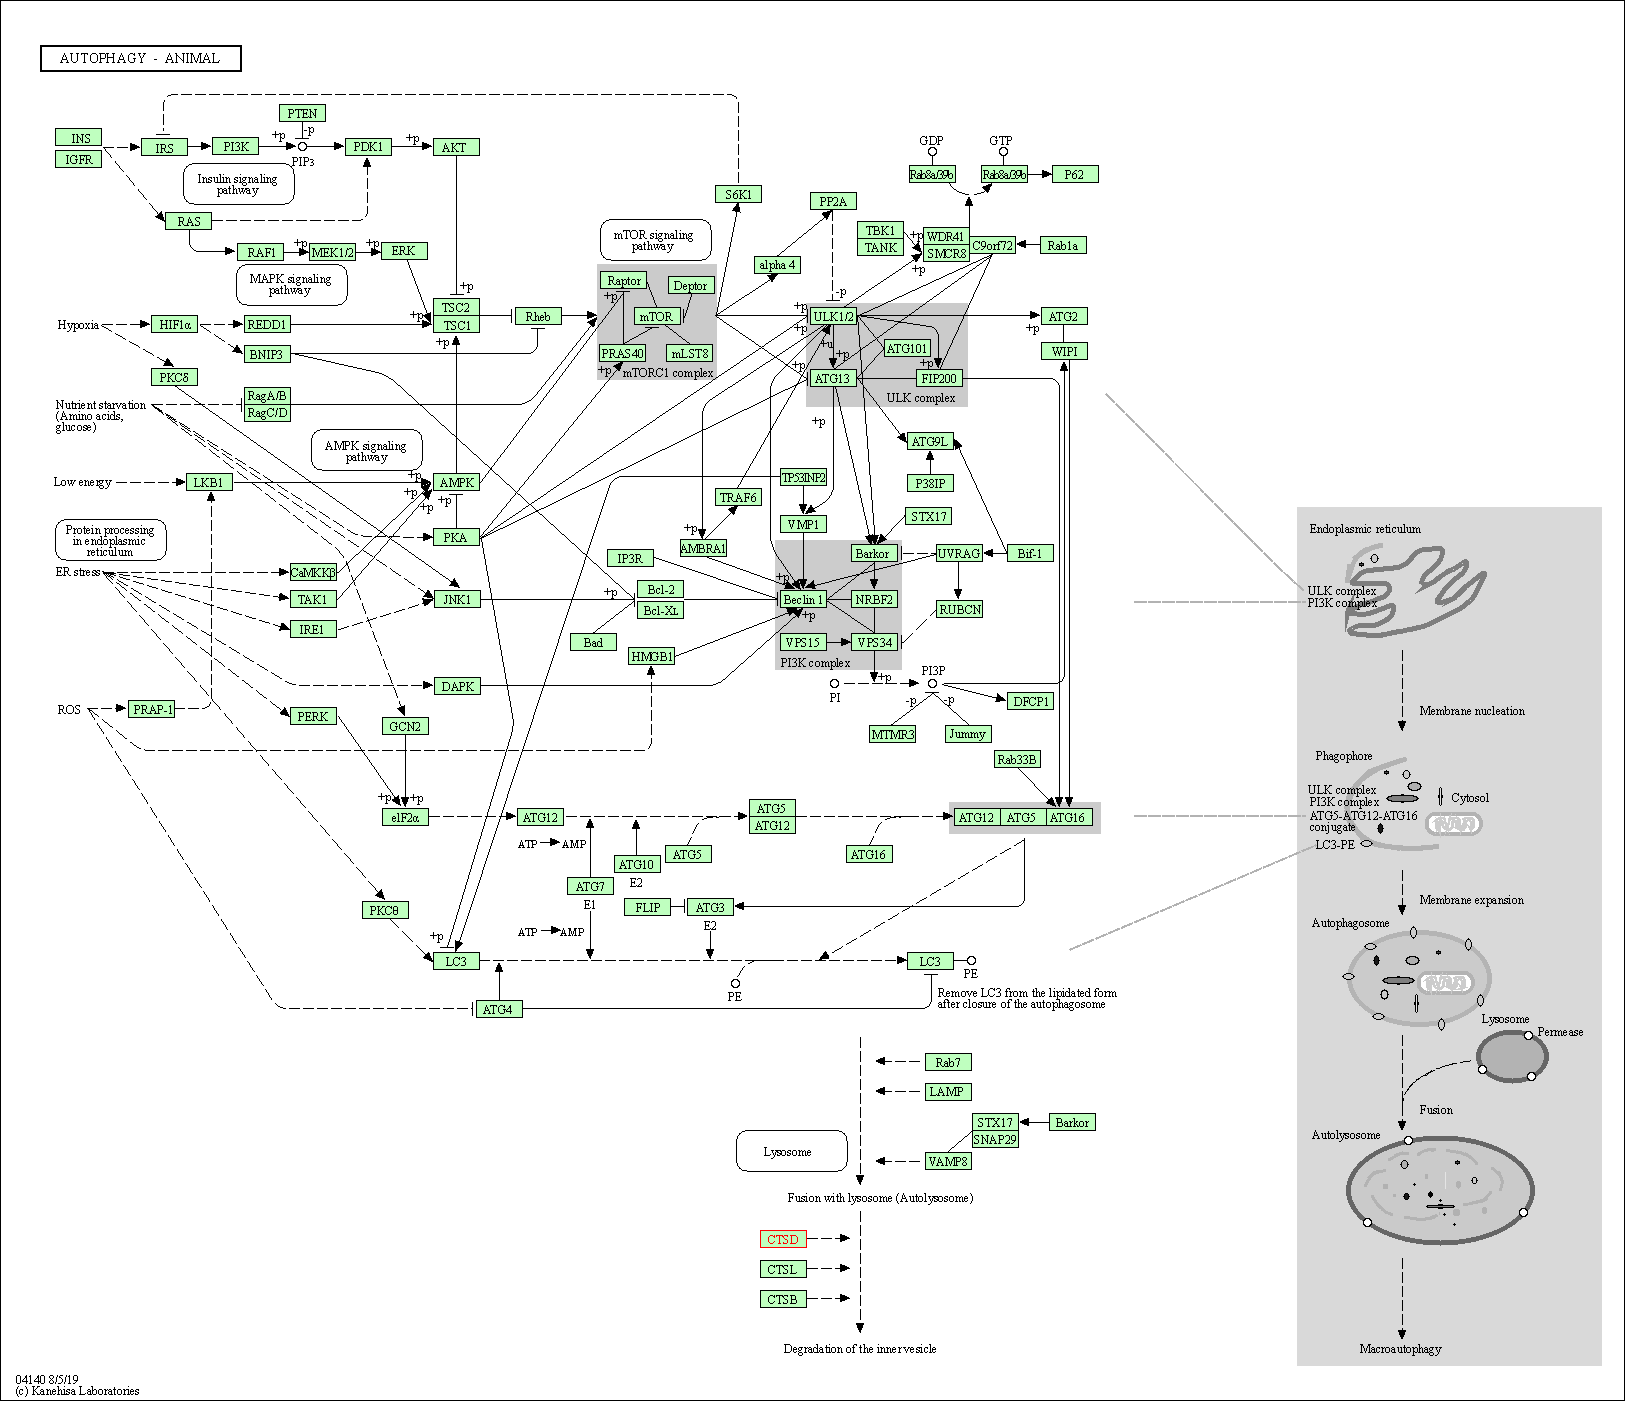
|
| Class: Cellular Processes => Transport and catabolism | Pathway Hierarchy | ||
| Lysosome | hsa04142 | Affiliated Target |
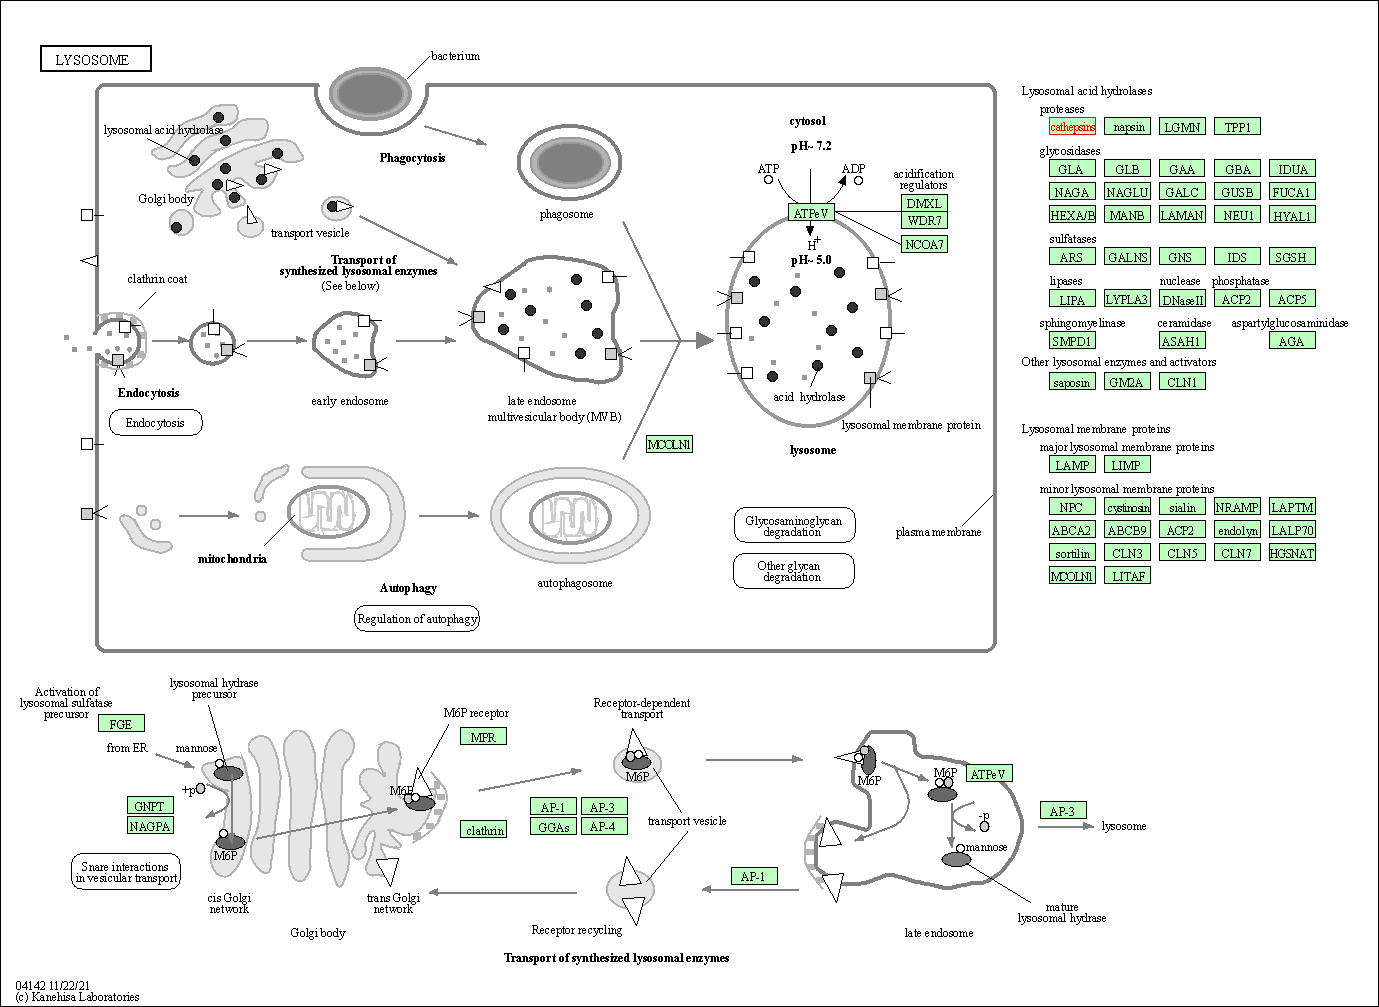
|
| Class: Cellular Processes => Transport and catabolism | Pathway Hierarchy | ||
| Apoptosis | hsa04210 | Affiliated Target |
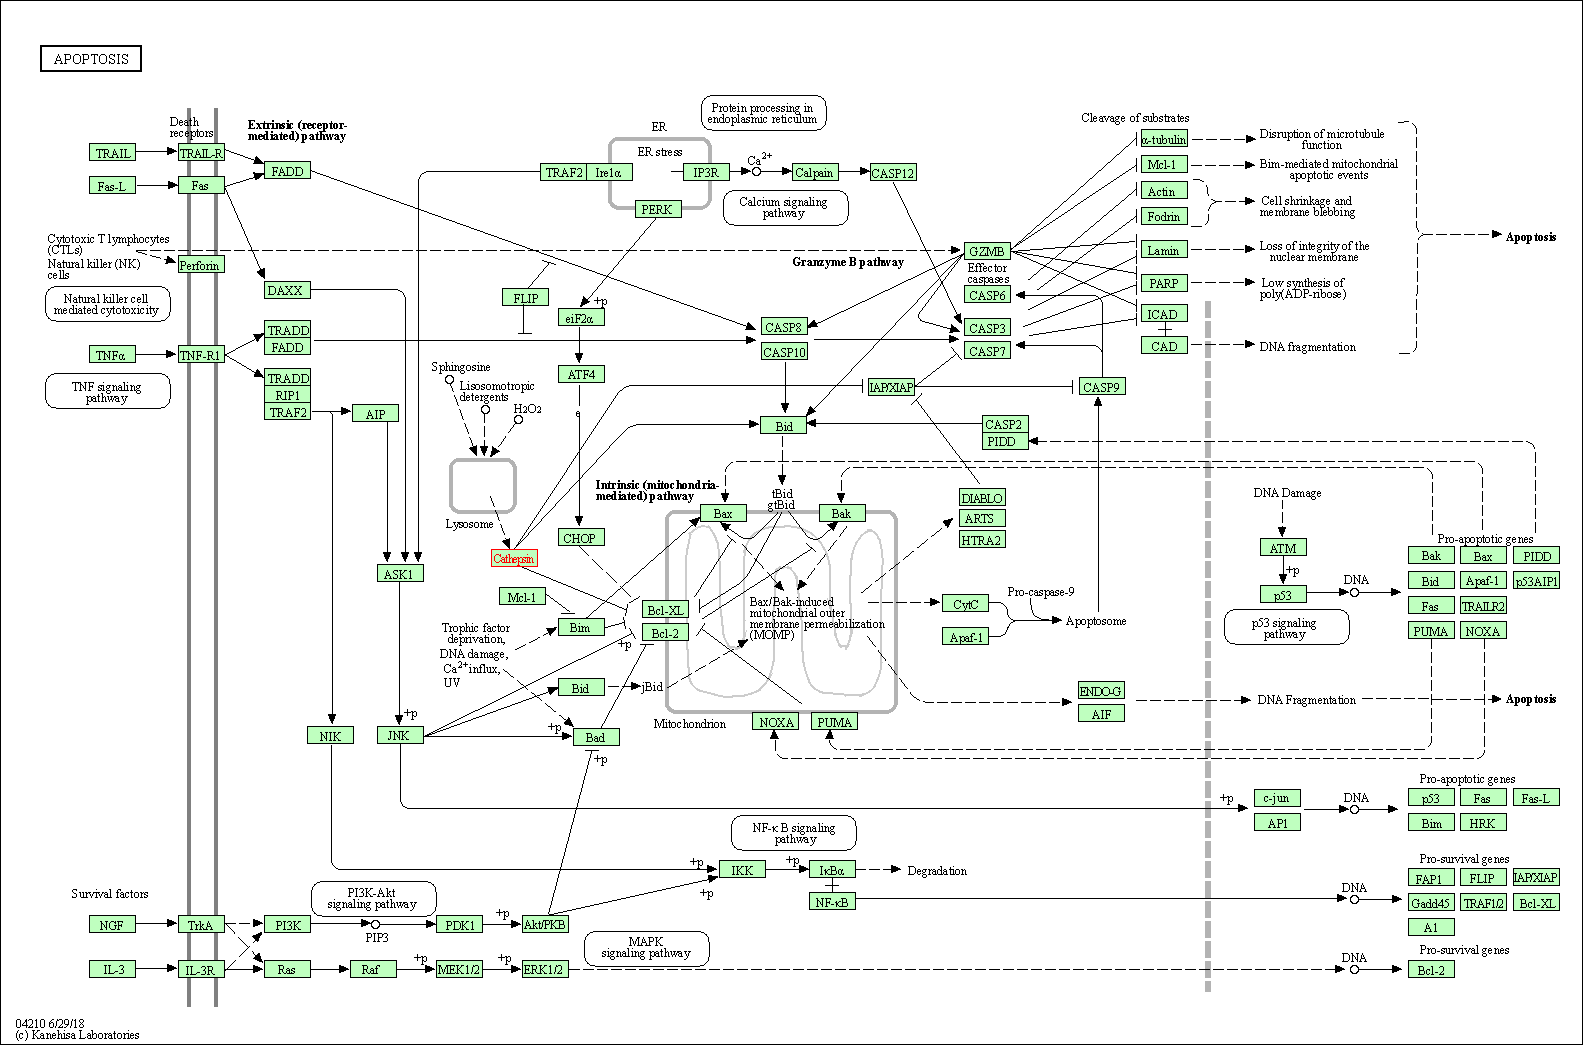
|
| Class: Cellular Processes => Cell growth and death | Pathway Hierarchy | ||
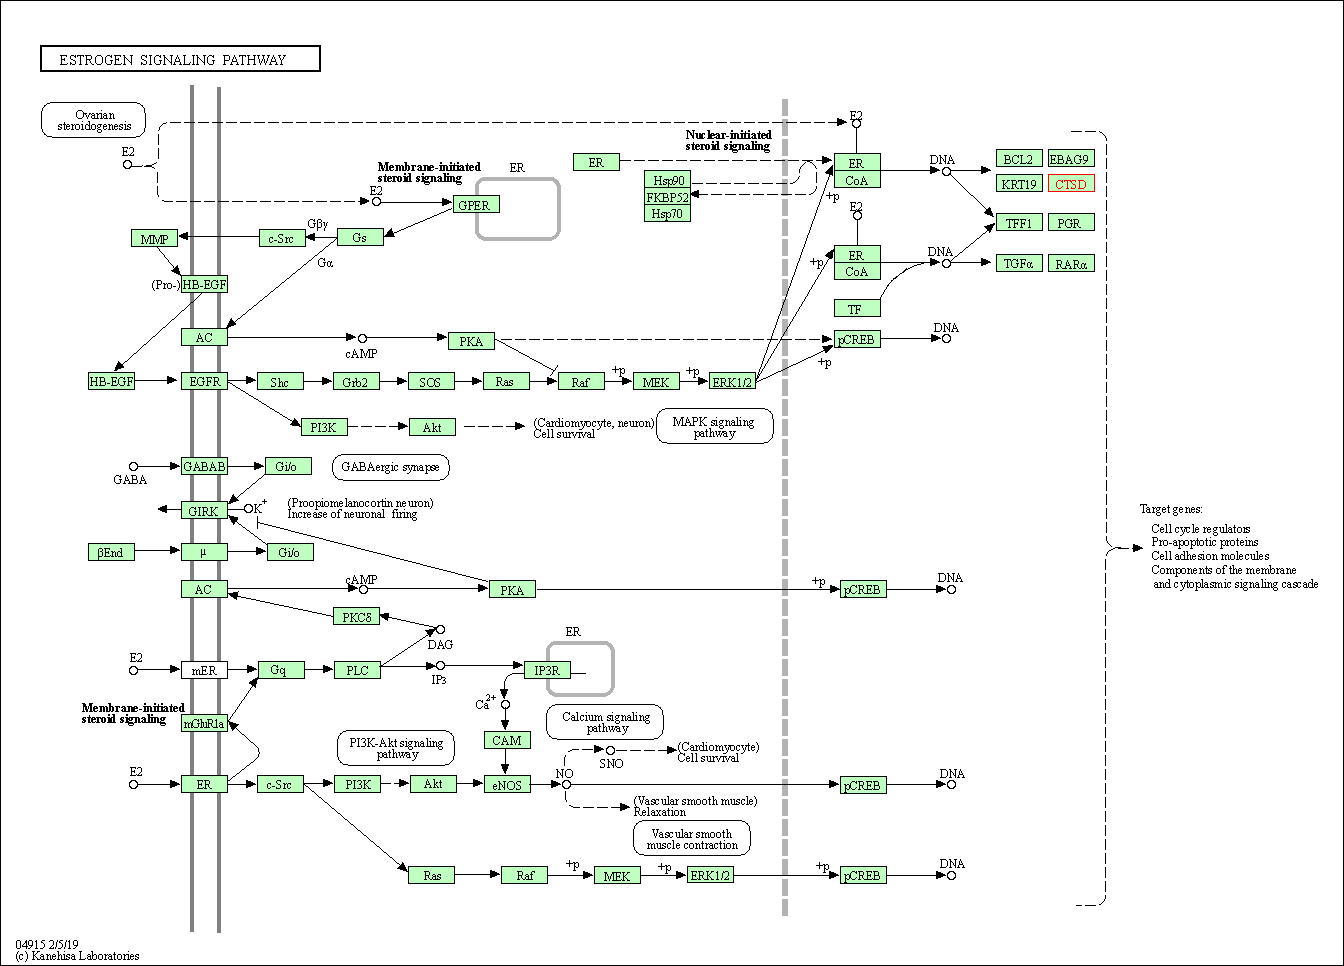
| Estrogen signaling pathway | hsa04915 | Affiliated Target |
|
| Class: Organismal Systems => Endocrine system | Pathway Hierarchy | ||
| Degree | 3 | Degree centrality | 3.22E-04 | Betweenness centrality | 1.75E-04 |
|---|---|---|---|---|---|
| Closeness centrality | 2.20E-01 | Radiality | 1.39E+01 | Clustering coefficient | 0.00E+00 |
| Neighborhood connectivity | 4.20E+01 | Topological coefficient | 3.36E-01 | Eccentricity | 12 |
| Download | Click to Download the Full PPI Network of This Target | ||||
| Chemical Structure based Activity Landscape of Target | Top |
|---|---|
| Drug Property Profile of Target | Top | |
|---|---|---|
| (1) Molecular Weight (mw) based Drug Clustering | (2) Octanol/Water Partition Coefficient (xlogp) based Drug Clustering | |
|
|
||
| (3) Hydrogen Bond Donor Count (hbonddonor) based Drug Clustering | (4) Hydrogen Bond Acceptor Count (hbondacc) based Drug Clustering | |
|
|
||
| (5) Rotatable Bond Count (rotbonds) based Drug Clustering | (6) Topological Polar Surface Area (polararea) based Drug Clustering | |
|
|
||
| "RO5" indicates the cutoff set by lipinski's rule of five; "D123AB" colored in GREEN denotes the no violation of any cutoff in lipinski's rule of five; "D123AB" colored in PURPLE refers to the violation of only one cutoff in lipinski's rule of five; "D123AB" colored in BLACK represents the violation of more than one cutoffs in lipinski's rule of five | ||
| Target Poor or Non Binders | Top | |||||
|---|---|---|---|---|---|---|
| Target Poor or Non Binders | ||||||
| Target Regulators | Top | |||||
|---|---|---|---|---|---|---|
| Target-regulating Transcription Factors | ||||||
| Target Profiles in Patients | Top | |||||
|---|---|---|---|---|---|---|
| Target Expression Profile (TEP) | ||||||
| Target Affiliated Biological Pathways | Top | |||||
|---|---|---|---|---|---|---|
| BioCyc | [+] 1 BioCyc Pathways | + | ||||
| 1 | Thyroid hormone biosynthesis | |||||
| KEGG Pathway | [+] 3 KEGG Pathways | + | ||||
| 1 | Sphingolipid signaling pathway | |||||
| 2 | Lysosome | |||||
| 3 | Tuberculosis | |||||
| NetPath Pathway | [+] 1 NetPath Pathways | + | ||||
| 1 | IL2 Signaling Pathway | |||||
| PID Pathway | [+] 4 PID Pathways | + | ||||
| 1 | LKB1 signaling events | |||||
| 2 | Ceramide signaling pathway | |||||
| 3 | Direct p53 effectors | |||||
| 4 | Validated nuclear estrogen receptor alpha network | |||||
| Reactome | [+] 3 Reactome Pathways | + | ||||
| 1 | Collagen degradation | |||||
| 2 | Metabolism of Angiotensinogen to Angiotensins | |||||
| 3 | MHC class II antigen presentation | |||||
| Target-Related Models and Studies | Top | |||||
|---|---|---|---|---|---|---|
| Target Validation | ||||||
| References | Top | |||||
|---|---|---|---|---|---|---|
| REF 1 | Synthesis and structure activity relationships of novel small molecule cathepsin D inhibitors. Bioorg Med Chem Lett. 1999 Sep 6;9(17):2531-6. | |||||
| REF 2 | URL: http://www.guidetopharmacology.org Nucleic Acids Res. 2015 Oct 12. pii: gkv1037. The IUPHAR/BPS Guide to PHARMACOLOGY in 2016: towards curated quantitative interactions between 1300 protein targets and 6000 ligands. (Ligand id: 6541). | |||||
| REF 3 | Trusted, scientifically sound profiles of drug programs, clinical trials, safety reports, and company deals, written by scientists. Springer. 2015. Adis Insight (drug id 800002298) | |||||
| REF 4 | Structure-activity relationships of a series of 2-amino-4-thiazole-containing renin inhibitors. J Med Chem. 1992 Jul 10;35(14):2562-72. | |||||
| REF 5 | How many drug targets are there Nat Rev Drug Discov. 2006 Dec;5(12):993-6. | |||||
| REF 6 | Structure-based design, synthesis, and memapsin 2 (BACE) inhibitory activity of carbocyclic and heterocyclic peptidomimetics. J Med Chem. 2005 Aug 11;48(16):5175-90. | |||||
| REF 7 | Design, synthesis, and X-ray structure of potent memapsin 2 (beta-secretase) inhibitors with isophthalamide derivatives as the P2-P3-ligands. J Med Chem. 2007 May 17;50(10):2399-407. | |||||
| REF 8 | alpha-Substituted norstatines as the transition-state mimic in inhibitors of multiple digestive vacuole malaria aspartic proteases. Bioorg Med Chem. 2009 Aug 15;17(16):5933-49. | |||||
| REF 9 | Specificity in the binding of inhibitors to the active site of human/primate aspartic proteinases: analysis of P2-P1-P1'-P2' variation. J Med Chem. 1993 Sep 3;36(18):2614-20. | |||||
| REF 10 | Structure-based optimization of non-peptidic Cathepsin D inhibitors. Bioorg Med Chem Lett. 2014 Sep 1;24(17):4141-50. | |||||
If You Find Any Error in Data or Bug in Web Service, Please Kindly Report It to Dr. Zhou and Dr. Zhang.

