Target Information
| Target General Information | Top | |||||
|---|---|---|---|---|---|---|
| Target ID |
T57278
(Former ID: TTDR01214)
|
|||||
| Target Name |
Ephrin type-A receptor 2 (EPHA2)
|
|||||
| Synonyms |
Tyrosine-protein kinase receptor ECK; Epithelial cell kinase; EphA2receptor; ECK
Click to Show/Hide
|
|||||
| Gene Name |
EPHA2
|
|||||
| Target Type |
Clinical trial target
|
[1] | ||||
| Disease | [+] 2 Target-related Diseases | + | ||||
| 1 | Brain cancer [ICD-11: 2A00] | |||||
| 2 | Solid tumour/cancer [ICD-11: 2A00-2F9Z] | |||||
| Function |
The signaling pathway downstream of the receptor is referred to as forward signaling while the signaling pathway downstream of the ephrin ligand is referred to as reverse signaling. Activated by the ligand ephrin-A1/EFNA1 regulates migration, integrin-mediated adhesion, proliferation and differentiation of cells. Regulates cell adhesion and differentiation through DSG1/desmoglein-1 and inhibition of the ERK1/ERK2 (MAPK3/MAPK1, respectively) signaling pathway. May also participate in UV radiation-induced apoptosis and have a ligand-independent stimulatory effect on chemotactic cell migration. During development, may function in distinctive aspects of pattern formation and subsequently in development of several fetal tissues. Involved for instance in angiogenesis, in early hindbrain development and epithelial proliferation and branching morphogenesis during mammary gland development. Engaged by the ligand ephrin-A5/EFNA5 may regulate lens fiber cells shape and interactions and be important for lens transparency development and maintenance. With ephrin-A2/EFNA2 may play a role in bone remodeling through regulation of osteoclastogenesis and osteoblastogenesis. Receptor tyrosine kinase which binds promiscuously membrane-bound ephrin-A family ligands residing on adjacent cells, leading to contact-dependent bidirectional signaling into neighboring cells.
Click to Show/Hide
|
|||||
| BioChemical Class |
Kinase
|
|||||
| UniProt ID | ||||||
| EC Number |
EC 2.7.10.1
|
|||||
| Sequence |
MELQAARACFALLWGCALAAAAAAQGKEVVLLDFAAAGGELGWLTHPYGKGWDLMQNIMN
DMPIYMYSVCNVMSGDQDNWLRTNWVYRGEAERIFIELKFTVRDCNSFPGGASSCKETFN LYYAESDLDYGTNFQKRLFTKIDTIAPDEITVSSDFEARHVKLNVEERSVGPLTRKGFYL AFQDIGACVALLSVRVYYKKCPELLQGLAHFPETIAGSDAPSLATVAGTCVDHAVVPPGG EEPRMHCAVDGEWLVPIGQCLCQAGYEKVEDACQACSPGFFKFEASESPCLECPEHTLPS PEGATSCECEEGFFRAPQDPASMPCTRPPSAPHYLTAVGMGAKVELRWTPPQDSGGREDI VYSVTCEQCWPESGECGPCEASVRYSEPPHGLTRTSVTVSDLEPHMNYTFTVEARNGVSG LVTSRSFRTASVSINQTEPPKVRLEGRSTTSLSVSWSIPPPQQSRVWKYEVTYRKKGDSN SYNVRRTEGFSVTLDDLAPDTTYLVQVQALTQEGQGAGSKVHEFQTLSPEGSGNLAVIGG VAVGVVLLLVLAGVGFFIHRRRKNQRARQSPEDVYFSKSEQLKPLKTYVDPHTYEDPNQA VLKFTTEIHPSCVTRQKVIGAGEFGEVYKGMLKTSSGKKEVPVAIKTLKAGYTEKQRVDF LGEAGIMGQFSHHNIIRLEGVISKYKPMMIITEYMENGALDKFLREKDGEFSVLQLVGML RGIAAGMKYLANMNYVHRDLAARNILVNSNLVCKVSDFGLSRVLEDDPEATYTTSGGKIP IRWTAPEAISYRKFTSASDVWSFGIVMWEVMTYGERPYWELSNHEVMKAINDGFRLPTPM DCPSAIYQLMMQCWQQERARRPKFADIVSILDKLIRAPDSLKTLADFDPRVSIRLPSTSG SEGVPFRTVSEWLESIKMQQYTEHFMAAGYTAIEKVVQMTNDDIKRIGVRLPGHQKRIAY SLLGLKDQVNTVGIPI Click to Show/Hide
|
|||||
| 3D Structure | Click to Show 3D Structure of This Target | AlphaFold | ||||
| HIT2.0 ID | T41WA8 | |||||
| Drugs and Modes of Action | Top | |||||
|---|---|---|---|---|---|---|
| Clinical Trial Drug(s) | [+] 3 Clinical Trial Drugs | + | ||||
| 1 | CAR-T cells targeting EphA2 | Drug Info | Phase 1/2 | Malignant glioma | [1] | |
| 2 | DS-8895 | Drug Info | Phase 1 | Solid tumour/cancer | [3] | |
| 3 | MEDI-547 | Drug Info | Phase 1 | Solid tumour/cancer | [4] | |
| Mode of Action | [+] 2 Modes of Action | + | ||||
| CAR-T-Cell-Therapy | [+] 1 CAR-T-Cell-Therapy drugs | + | ||||
| 1 | CAR-T cells targeting EphA2 | Drug Info | [1] | |||
| Inhibitor | [+] 3 Inhibitor drugs | + | ||||
| 1 | AMP-PNP | Drug Info | [9] | |||
| 2 | PMID19788238C66 | Drug Info | [10] | |||
| 3 | PMID21561767C8h | Drug Info | [11] | |||
| Cell-based Target Expression Variations | Top | |||||
|---|---|---|---|---|---|---|
| Cell-based Target Expression Variations | ||||||
| Drug Binding Sites of Target | Top | |||||
|---|---|---|---|---|---|---|
| Ligand Name: Dasatinib | Ligand Info | |||||
| Structure Description | Crystal Structure of Ephrin A2 (EphA2) Receptor Protein Kinase with dasatinib | PDB:5I9Y | ||||
| Method | X-ray diffraction | Resolution | 1.23 Å | Mutation | No | [12] |
| PDB Sequence |
AVLKFTTEIH
609 PSCVTRQKVI619 GAGEFGEVYK629 GMLKTKKEVP642 VAIKTLKAGY652 TEKQRVDFLG 662 EAGIMGQFSH672 HNIIRLEGVI682 SKYKPMMIIT692 EYMENGALDK702 FLREKDGEFS 712 VLQLVGMLRG722 IAAGMKYLAN732 MNYVHRDLAA742 RNILVNSNLV752 CKVSDFGLSR 762 VLEDDPEATY772 PIRWTAPEAI789 SYRKFTSASD799 VWSFGIVMWE809 VMTYGERPYW 819 ELSNHEVMKA829 INDGFRLPTP839 MDCPSAIYQL849 MMQCWQQERA859 RRPKFADIVS 869 ILDKLIRAPD879 SLKTLADFDP889 RVSIRLP
|
|||||
|
|
ILE619
3.409
GLY620
4.928
VAL627
4.055
ALA644
3.285
ILE645
3.818
LYS646
3.594
GLU663
3.482
MET667
3.815
ILE676
4.015
ILE690
3.599
ILE691
4.841
THR692
2.908
|
|||||
| Ligand Name: Bosutinib | Ligand Info | |||||
| Structure Description | Crystal Structure of Ephrin A2 (EphA2) Receptor Protein Kinase with bosutinib (SKI-606) | PDB:5I9X | ||||
| Method | X-ray diffraction | Resolution | 1.43 Å | Mutation | No | [12] |
| PDB Sequence |
FTTEIHPSCV
613 TRQKVIGAGE623 FGEVYKGMLK633 TEVPVAIKTL648 KAGYTEKQRV658 DFLGEAGIMG 668 QFSHHNIIRL678 EGVISKYKPM688 MIITEYMENG698 ALDKFLREKD708 GEFSVLQLVG 718 MLRGIAAGMK728 YLANMNYVHR738 DLAARNILVN748 SNLVCKVSDF758 GLSRVLEDDP 768 EATYGKIPIR782 WTAPEAISYR792 KFTSASDVWS802 FGIVMWEVMT812 YGERPYWELS 822 NHEVMKAIND832 GFRLPTPMDC842 PSAIYQLMMQ852 CWQQERARRP862 KFADIVSILD 872 KLIRAPDSLK882 TLADFDPRVS892 IRLP
|
|||||
|
|
ILE619
3.415
GLY620
4.173
VAL627
4.120
ALA644
3.174
ILE645
3.579
LYS646
3.334
GLU663
3.390
MET667
4.277
ILE676
3.383
ILE690
3.345
ILE691
4.556
|
|||||
| Click to View More Binding Site Information of This Target with Different Ligands | ||||||
| Different Human System Profiles of Target | Top |
|---|---|
|
Human Similarity Proteins
of target is determined by comparing the sequence similarity of all human proteins with the target based on BLAST. The similarity proteins for a target are defined as the proteins with E-value < 0.005 and outside the protein families of the target.
A target that has fewer human similarity proteins outside its family is commonly regarded to possess a greater capacity to avoid undesired interactions and thus increase the possibility of finding successful drugs
(Brief Bioinform, 21: 649-662, 2020).
Human Tissue Distribution
of target is determined from a proteomics study that quantified more than 12,000 genes across 32 normal human tissues. Tissue Specificity (TS) score was used to define the enrichment of target across tissues.
The distribution of targets among different tissues or organs need to be taken into consideration when assessing the target druggability, as it is generally accepted that the wider the target distribution, the greater the concern over potential adverse effects
(Nat Rev Drug Discov, 20: 64-81, 2021).
Human Pathway Affiliation
of target is determined by the life-essential pathways provided on KEGG database. The target-affiliated pathways were defined based on the following two criteria (a) the pathways of the studied target should be life-essential for both healthy individuals and patients, and (b) the studied target should occupy an upstream position in the pathways and therefore had the ability to regulate biological function.
Targets involved in a fewer pathways have greater likelihood to be successfully developed, while those associated with more human pathways increase the chance of undesirable interferences with other human processes
(Pharmacol Rev, 58: 259-279, 2006).
Biological Network Descriptors
of target is determined based on a human protein-protein interactions (PPI) network consisting of 9,309 proteins and 52,713 PPIs, which were with a high confidence score of ≥ 0.95 collected from STRING database.
The network properties of targets based on protein-protein interactions (PPIs) have been widely adopted for the assessment of target’s druggability. Proteins with high node degree tend to have a high impact on network function through multiple interactions, while proteins with high betweenness centrality are regarded to be central for communication in interaction networks and regulate the flow of signaling information
(Front Pharmacol, 9, 1245, 2018;
Curr Opin Struct Biol. 44:134-142, 2017).
Human Similarity Proteins
Human Tissue Distribution
Human Pathway Affiliation
Biological Network Descriptors
|
|
|
Note:
If a protein has TS (tissue specficity) scores at least in one tissue >= 2.5, this protein is called tissue-enriched (including tissue-enriched-but-not-specific and tissue-specific). In the plots, the vertical lines are at thresholds 2.5 and 4.
|
| KEGG Pathway | Pathway ID | Affiliated Target | Pathway Map |
|---|---|---|---|
| MAPK signaling pathway | hsa04010 | Affiliated Target |
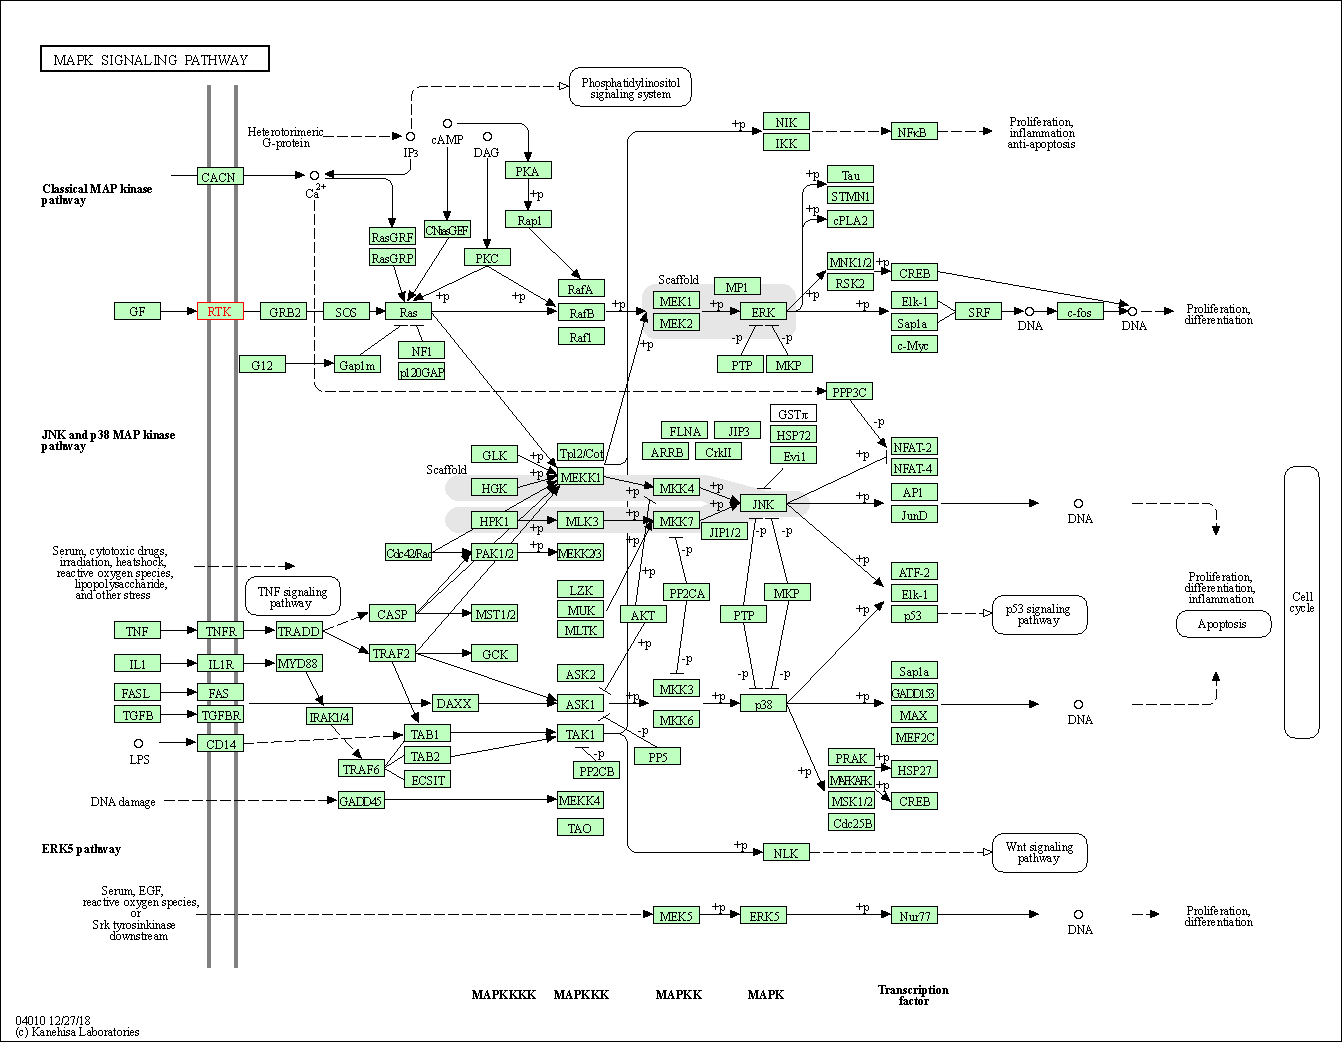
|
| Class: Environmental Information Processing => Signal transduction | Pathway Hierarchy | ||
| Ras signaling pathway | hsa04014 | Affiliated Target |
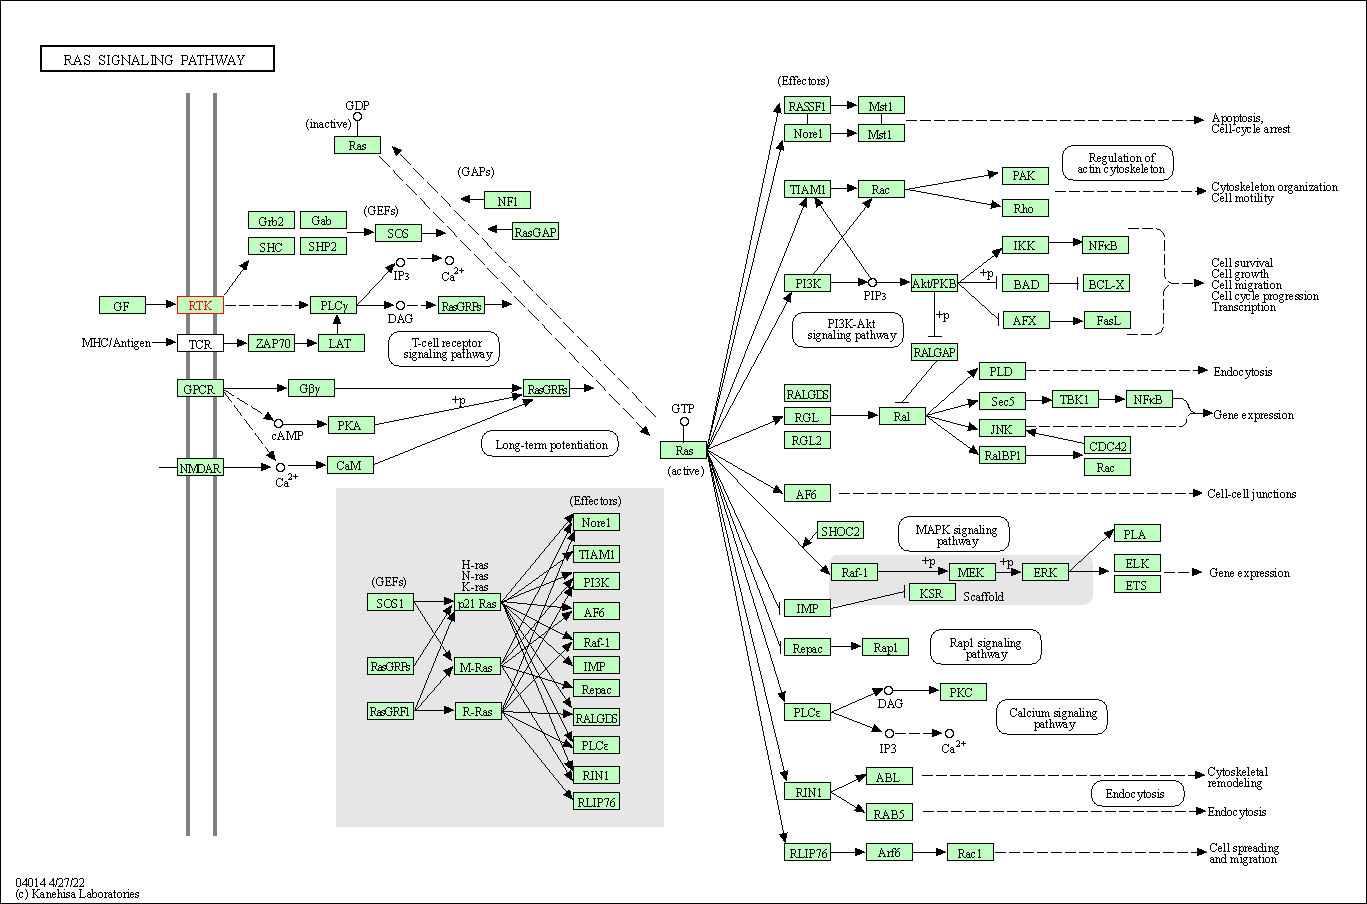
|
| Class: Environmental Information Processing => Signal transduction | Pathway Hierarchy | ||
| Rap1 signaling pathway | hsa04015 | Affiliated Target |
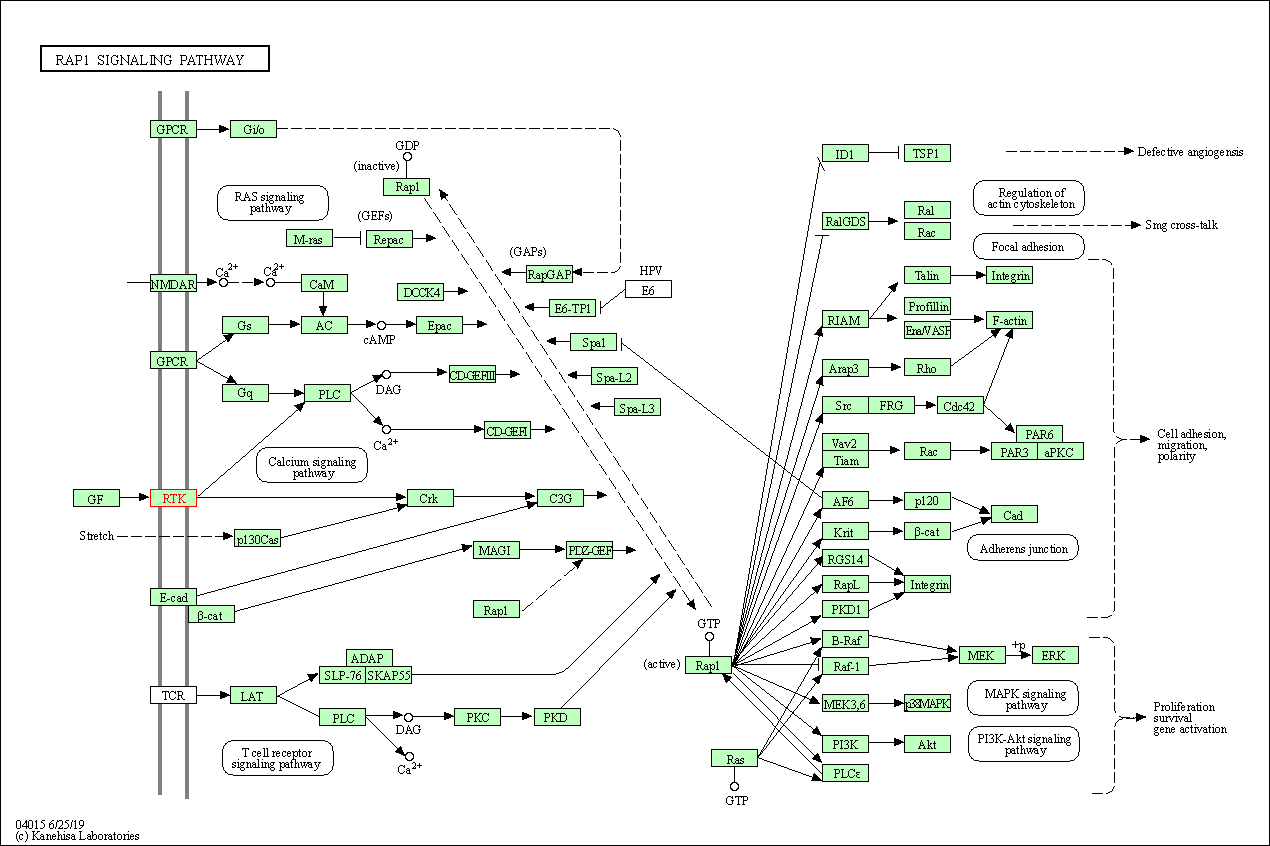
|
| Class: Environmental Information Processing => Signal transduction | Pathway Hierarchy | ||
| PI3K-Akt signaling pathway | hsa04151 | Affiliated Target |
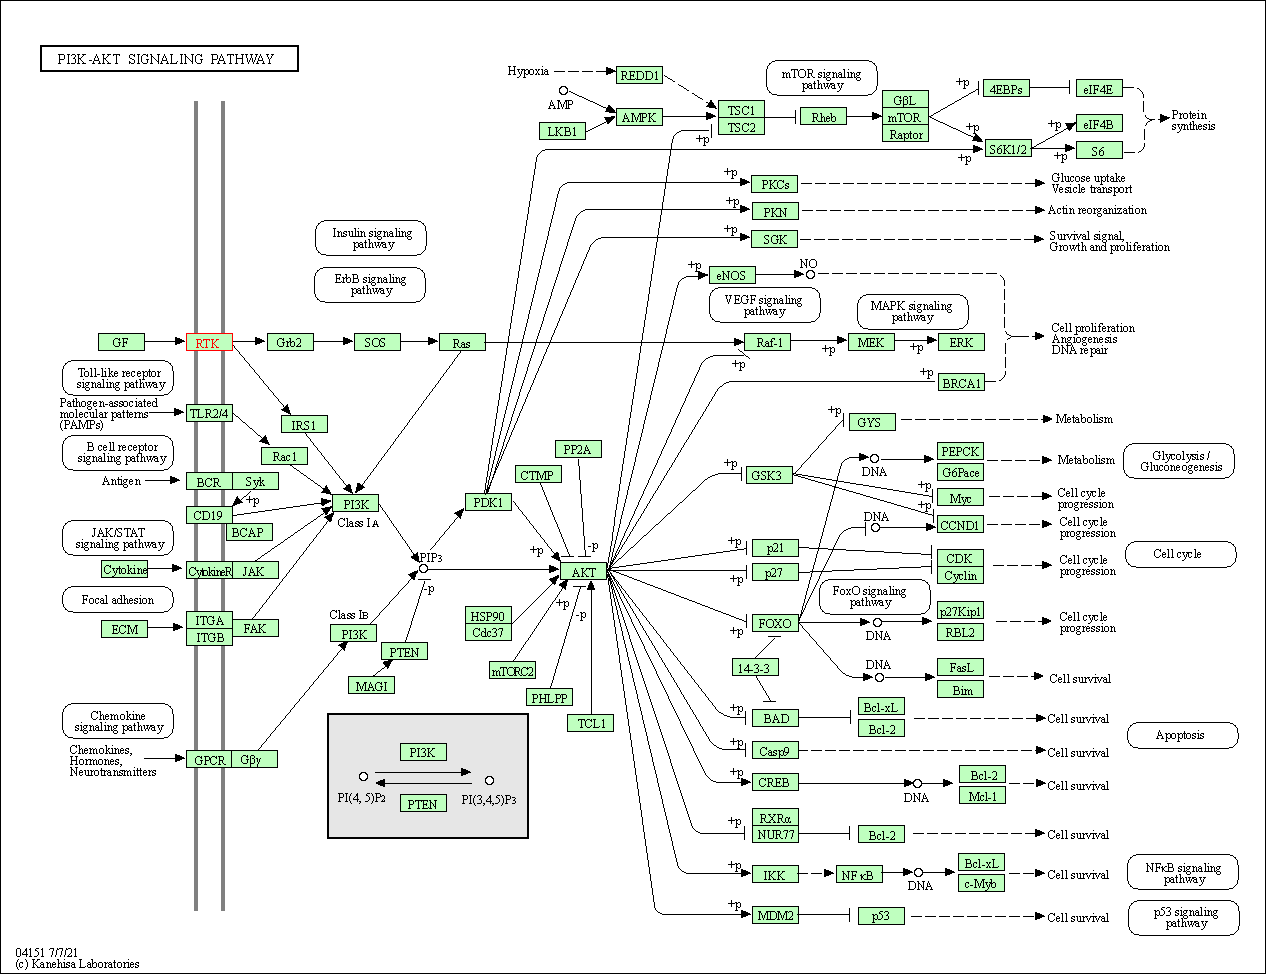
|
| Class: Environmental Information Processing => Signal transduction | Pathway Hierarchy | ||
| Axon guidance | hsa04360 | Affiliated Target |
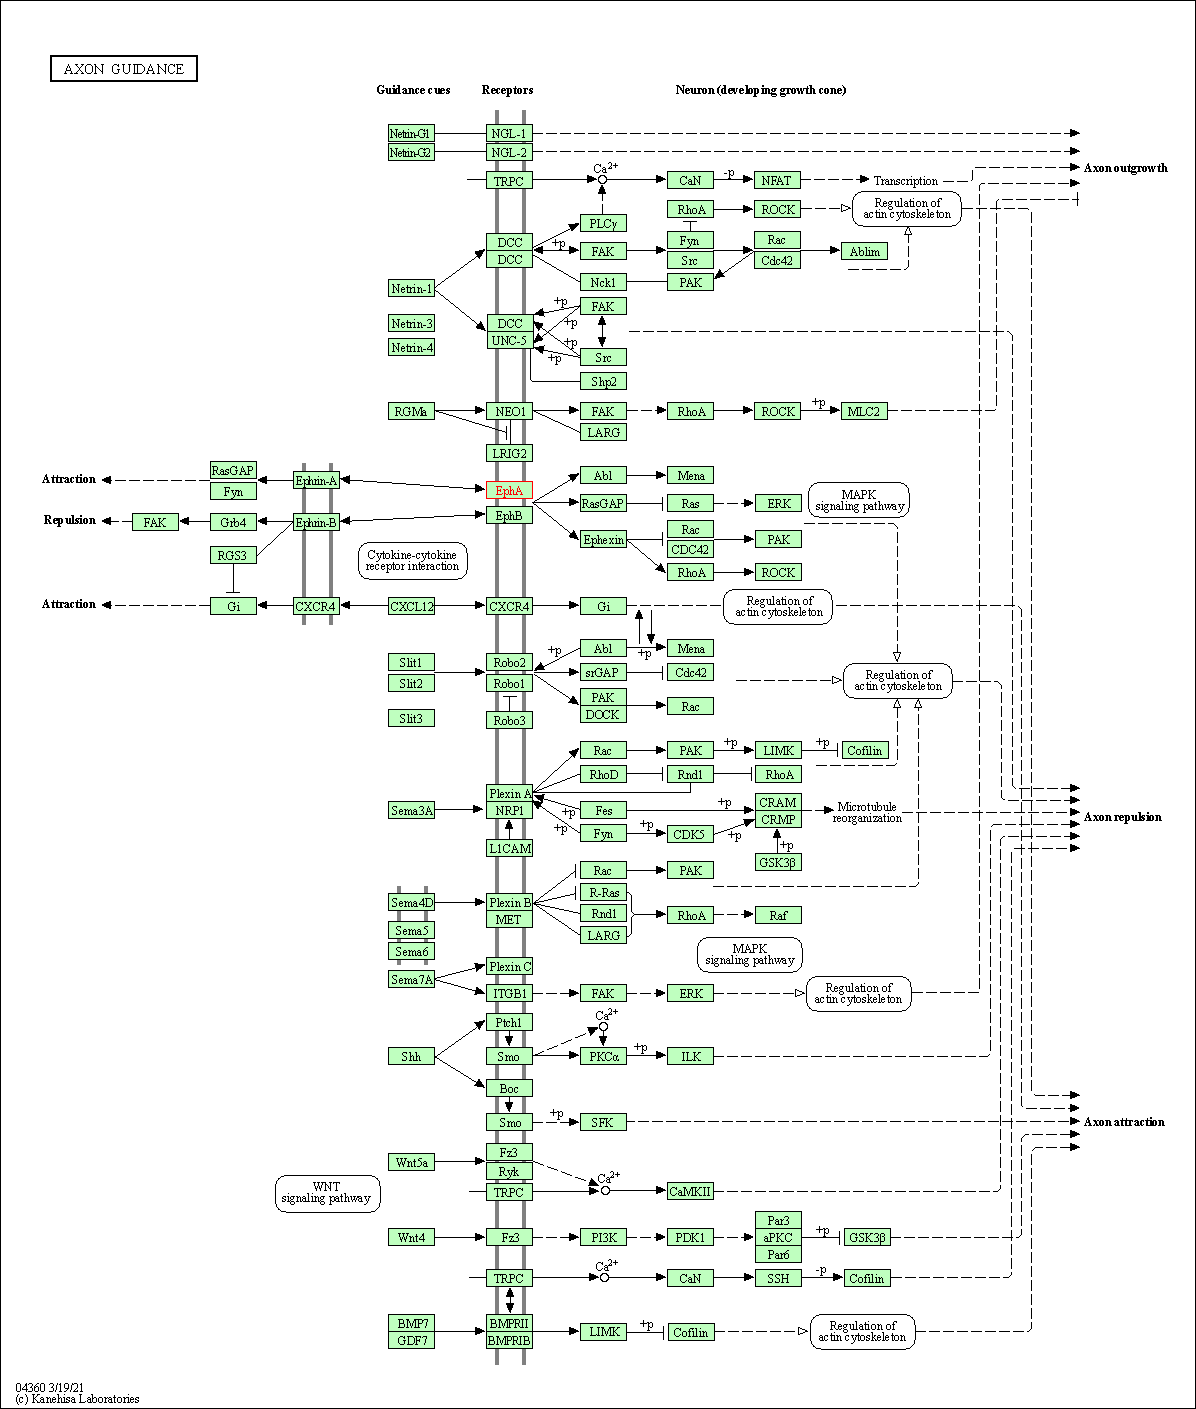
|
| Class: Organismal Systems => Development and regeneration | Pathway Hierarchy | ||
| Degree | 16 | Degree centrality | 1.72E-03 | Betweenness centrality | 8.76E-04 |
|---|---|---|---|---|---|
| Closeness centrality | 2.40E-01 | Radiality | 1.42E+01 | Clustering coefficient | 1.67E-01 |
| Neighborhood connectivity | 5.36E+01 | Topological coefficient | 1.03E-01 | Eccentricity | 12 |
| Download | Click to Download the Full PPI Network of This Target | ||||
| Chemical Structure based Activity Landscape of Target | Top |
|---|---|
| Drug Property Profile of Target | Top | |
|---|---|---|
| (1) Molecular Weight (mw) based Drug Clustering | (2) Octanol/Water Partition Coefficient (xlogp) based Drug Clustering | |
|
|
||
| (3) Hydrogen Bond Donor Count (hbonddonor) based Drug Clustering | (4) Hydrogen Bond Acceptor Count (hbondacc) based Drug Clustering | |
|
|
||
| (5) Rotatable Bond Count (rotbonds) based Drug Clustering | (6) Topological Polar Surface Area (polararea) based Drug Clustering | |
|
|
||
| "RO5" indicates the cutoff set by lipinski's rule of five; "D123AB" colored in GREEN denotes the no violation of any cutoff in lipinski's rule of five; "D123AB" colored in PURPLE refers to the violation of only one cutoff in lipinski's rule of five; "D123AB" colored in BLACK represents the violation of more than one cutoffs in lipinski's rule of five | ||
| Target Poor or Non Binders | Top | |||||
|---|---|---|---|---|---|---|
| Target Poor or Non Binders | ||||||
| Target Regulators | Top | |||||
|---|---|---|---|---|---|---|
| Target-regulating microRNAs | ||||||
| Target-interacting Proteins | ||||||
| Target Affiliated Biological Pathways | Top | |||||
|---|---|---|---|---|---|---|
| KEGG Pathway | [+] 4 KEGG Pathways | + | ||||
| 1 | Ras signaling pathway | |||||
| 2 | Rap1 signaling pathway | |||||
| 3 | PI3K-Akt signaling pathway | |||||
| 4 | Axon guidance | |||||
| NetPath Pathway | [+] 1 NetPath Pathways | + | ||||
| 1 | TGF_beta_Receptor Signaling Pathway | |||||
| PID Pathway | [+] 6 PID Pathways | + | ||||
| 1 | EphrinA-EPHA pathway | |||||
| 2 | Arf6 signaling events | |||||
| 3 | Direct p53 effectors | |||||
| 4 | EPHA forward signaling | |||||
| 5 | Stabilization and expansion of the E-cadherin adherens junction | |||||
| 6 | EPHA2 forward signaling | |||||
| Reactome | [+] 3 Reactome Pathways | + | ||||
| 1 | EPH-Ephrin signaling | |||||
| 2 | EPHA-mediated growth cone collapse | |||||
| 3 | EPH-ephrin mediated repulsion of cells | |||||
| WikiPathways | [+] 1 WikiPathways | + | ||||
| 1 | NRF2 pathway | |||||
| References | Top | |||||
|---|---|---|---|---|---|---|
| REF 1 | ClinicalTrials.gov (NCT02575261) CAR-T Cell Immunotherapy for EphA2 Positive Malignant Glioma Patients | |||||
| REF 2 | ClinicalTrials.gov (NCT04180371) Study BT5528-100 in Patients With Advanced Solid Tumors Associated With EphA2 Expression. U.S. National Institutes of Health. | |||||
| REF 3 | ClinicalTrials.gov (NCT02252211) Safety and Bio-Imaging Trial of DS-8895a in Patients With Advanced EphA2 Positive Cancers. U.S. National Institutes of Health. | |||||
| REF 4 | ClinicalTrials.gov (NCT00796055) Study of MEDI-547 to Evaluate the Safety, Tolerability, and Biologic Activity of IV Administration in Subjects With Relapsed or Refractory Solid Tumors. U.S. NationalInstitutes of Health. | |||||
| REF 5 | Trusted, scientifically sound profiles of drug programs, clinical trials, safety reports, and company deals, written by scientists. Springer. 2015. Adis Insight (drug id 800016645) | |||||
| REF 6 | Clinical pipeline report, company report or official report of Daiichi Sankyo. | |||||
| REF 7 | Therapeutic target database update 2012: a resource for facilitating target-oriented drug discovery. Nucleic Acids Res. 2012 Jan;40(Database issue):D1128-36. | |||||
| REF 8 | URL: http://www.guidetopharmacology.org Nucleic Acids Res. 2015 Oct 12. pii: gkv1037. The IUPHAR/BPS Guide to PHARMACOLOGY in 2016: towards curated quantitative interactions between 1300 protein targets and 6000 ligands. (Target id: 1822). | |||||
| REF 9 | The Protein Data Bank. Nucleic Acids Res. 2000 Jan 1;28(1):235-42. | |||||
| REF 10 | Structure-based optimization of potent and selective inhibitors of the tyrosine kinase erythropoietin producing human hepatocellular carcinoma receptor B4 (EphB4). J Med Chem. 2009 Oct 22;52(20):6433-46. | |||||
| REF 11 | Discovery of 5-(arenethynyl) hetero-monocyclic derivatives as potent inhibitors of BCR-ABL including the T315I gatekeeper mutant. Bioorg Med Chem Lett. 2011 Jun 15;21(12):3743-8. | |||||
| REF 12 | Chemical Proteomics and Structural Biology Define EPHA2 Inhibition by Clinical Kinase Drugs. ACS Chem Biol. 2016 Dec 16;11(12):3400-3411. | |||||
If You Find Any Error in Data or Bug in Web Service, Please Kindly Report It to Dr. Zhou and Dr. Zhang.

