Target Information
| Target General Information | Top | |||||
|---|---|---|---|---|---|---|
| Target ID |
T66538
(Former ID: TTDI01971)
|
|||||
| Target Name |
Calcium-activated potassium channel KCa1.1 (KCNMA1)
|
|||||
| Synonyms |
hSlo; Slowpoke homolog; Slo1; Slo-alpha; Slo homolog; SLO; MaxiK; Maxi K channel; KCa1.1; KCNMA; K(VCA)alpha; Calcium-activated potassium channel, subfamily M subunit alpha-1; Calcium-activated potassium channel subunit alpha-1; BKCA alpha; BK channel
Click to Show/Hide
|
|||||
| Gene Name |
KCNMA1
|
|||||
| Target Type |
Clinical trial target
|
[1] | ||||
| Disease | [+] 2 Target-related Diseases | + | ||||
| 1 | Asthma [ICD-11: CA23] | |||||
| 2 | Functional bladder disorder [ICD-11: GC50] | |||||
| Function |
Potassium channel activated by both membrane depolarization or increase in cytosolic Ca(2+) that mediates export of K(+). It is also activated by the concentration of cytosolic Mg(2+). Its activation dampens the excitatory events that elevate the cytosolic Ca(2+) concentration and/or depolarize the cell membrane. It therefore contributes to repolarization of the membrane potential. Plays a key role in controlling excitability in a number of systems, such as regulation of the contraction of smooth muscle, the tuning of hair cells in the cochlea, regulation of transmitter release, and innate immunity. In smooth muscles, its activation by high level of Ca(2+), caused by ryanodine receptors in the sarcoplasmic reticulum, regulates the membrane potential. In cochlea cells, its number and kinetic properties partly determine the characteristic frequency of each hair cell and thereby helps to establish a tonotopic map. Kinetics of KCNMA1 channels are determined by alternative splicing, phosphorylation status and its combination with modulating beta subunits. Highly sensitive to both iberiotoxin (IbTx) and charybdotoxin (CTX).
Click to Show/Hide
|
|||||
| BioChemical Class |
Voltage-gated ion channel
|
|||||
| UniProt ID | ||||||
| Sequence |
MANGGGGGGGSSGGGGGGGGSSLRMSSNIHANHLSLDASSSSSSSSSSSSSSSSSSSSSS
VHEPKMDALIIPVTMEVPCDSRGQRMWWAFLASSMVTFFGGLFIILLWRTLKYLWTVCCH CGGKTKEAQKINNGSSQADGTLKPVDEKEEAVAAEVGWMTSVKDWAGVMISAQTLTGRVL VVLVFALSIGALVIYFIDSSNPIESCQNFYKDFTLQIDMAFNVFFLLYFGLRFIAANDKL WFWLEVNSVVDFFTVPPVFVSVYLNRSWLGLRFLRALRLIQFSEILQFLNILKTSNSIKL VNLLSIFISTWLTAAGFIHLVENSGDPWENFQNNQALTYWECVYLLMVTMSTVGYGDVYA KTTLGRLFMVFFILGGLAMFASYVPEIIELIGNRKKYGGSYSAVSGRKHIVVCGHITLES VSNFLKDFLHKDRDDVNVEIVFLHNISPNLELEALFKRHFTQVEFYQGSVLNPHDLARVK IESADACLILANKYCADPDAEDASNIMRVISIKNYHPKIRIITQMLQYHNKAHLLNIPSW NWKEGDDAICLAELKLGFIAQSCLAQGLSTMLANLFSMRSFIKIEEDTWQKYYLEGVSNE MYTEYLSSAFVGLSFPTVCELCFVKLKLLMIAIEYKSANRESRILINPGNHLKIQEGTLG FFIASDAKEVKRAFFYCKACHDDITDPKRIKKCGCKRPKMSIYKRMRRACCFDCGRSERD CSCMSGRVRGNVDTLERAFPLSSVSVNDCSTSFRAFEDEQPSTLSPKKKQRNGGMRNSPN TSPKLMRHDPLLIPGNDQIDNMDSNVKKYDSTGMFHWCAPKEIEKVILTRSEAAMTVLSG HVVVCIFGDVSSALIGLRNLVMPLRASNFHYHELKHIVFVGSIEYLKREWETLHNFPKVS ILPGTPLSRADLRAVNINLCDMCVILSANQNNIDDTSLQDKECILASLNIKSMQFDDSIG VLQANSQGFTPPGMDRSSPDNSPVHGMLRQPSITTGVNIPIITELVNDTNVQFLDQDDDD DPDTELYLTQPFACGTAFAVSVLDSLMSATYFNDNILTLIRTLVTGGATPELEALIAEEN ALRGGYSTPQTLANRDRCRVAQLALLDGPFADLGDGGCYGDLFCKALKTYNMLCFGIYRL RDAHLSTPSQCTKRYVITNPPYEFELVPTDLIFCLMQFDHNAGQSRASLSHSSHSSQSSS KKSSSVHSIPSTANRQNRPKSRESRDKQKYVQEERL Click to Show/Hide
|
|||||
| 3D Structure | Click to Show 3D Structure of This Target | PDB | ||||
| Cell-based Target Expression Variations | Top | |||||
|---|---|---|---|---|---|---|
| Cell-based Target Expression Variations | ||||||
| Drug Binding Sites of Target | Top | |||||
|---|---|---|---|---|---|---|
| Ligand Name: Cholesterol | Ligand Info | |||||
| Structure Description | Cryo-EM structure of Ca2+-bound hsSlo1-beta4 channel complex | PDB:6V22 | ||||
| Method | Electron microscopy | Resolution | 3.20 Å | Mutation | No | [4] |
| PDB Sequence |
SRGQRMWWAF
25 LASSMVTFFG35 GLFIILLWRT45 LKYLWTVCCV91 GWMTSVKDWA101 GVMISAQTLT 111 GRVLVVLVFA121 LSIGALVIYF131 IDSSNPIESC141 QNFYKDFTLQ151 IDMAFNVFFL 161 LYFGLRFIAA171 NDKLWFWLEV181 NSVVDFFTVP191 PVFVSVYLNR201 SWLGLRFLRA 211 LRLIQFSEIL221 QFLNILKTSN231 SIKLVNLLSI241 FISTWLTAAG251 FIHLVENSGD 261 PWENFQNNQA271 LTYWECVYLL281 MVTMSTVGYG291 DVYAKTTLGR301 LFMVFFILGG 311 LAMFASYVPE321 IIELIGNRKK331 YGGSYSAVSG341 RKHIVVCGHI351 TLESVSNFLK 361 DFLHKDRDDV371 NVEIVFLHNI381 SPNLELEALF391 KRHFTQVEFY401 QGSVLNPHDL 411 ARVKIESADA421 CLILANKYCA431 DPDAEDASNI441 MRVISIKNYH451 PKIRIITQML 461 QYHNKAHLLN471 IPSWNWKEGD481 DAICLAELKL491 GFIAQSCLAQ501 GLSTMLANLF 511 SMRSFIKIEE521 DTWQKYYLEG531 VSNEMYTEYL541 SSAFVGLSFP551 TVCELCFVKL 561 KLLMIAIESR578 ILINPGNHLK588 IQEGTLGFFI598 ASDAKEVKRA608 FFYCKACSNV 683 KKYDSTGMFH693 WCAPKEIEKV703 ILTRSEAAMT713 VLSGHVVVCI723 FGDVSSALIG 733 LRNLVMPLRA743 SNFHYHELKH753 IVFVGSIEYL763 KREWETLHNF773 PKVSILPGTP 783 LSRADLRAVN793 INLCDMCVIL803 SANQNNIDDT813 SLQDKECILA823 SLNIKSMQFD 833 TTGVNIPIIT880 ELVNDTNVQF890 LDQDDDDDPD900 TELYLTQPFA910 CGTAFAVSVL 920 DSLMSATYFN930 DNILTLIRTL940 VTGGATPELE950 ALIAEENALR960 GGYSTPQTLA 970 NRDRCRVAQL980 ALLDGPFADL990 GDGGCYGDLF1000 CKALKTYNML1010 CFGIYRLRDA 1020 HLSTPSQCTK1030 RYVITNPPYE1040 FELVPTDLIF1050 CLMQFD
|
|||||
|
|
MET21
3.703
TRP22
4.146
TRP23
3.764
ALA24
3.658
LEU26
4.662
ALA27
4.757
SER28
3.434
MET30
4.586
VAL31
4.130
THR32
1.375
GLY36
3.747
ILE39
3.749
ILE40
4.006
TRP43
3.795
|
|||||
| Click to View More Binding Site Information of This Target and Ligand Pair | ||||||
| Ligand Name: (1r)-2-{[(S)-{[(2s)-2,3-Dihydroxypropyl]oxy}(Hydroxy)phosphoryl]oxy}-1-[(Hexadecanoyloxy)methyl]ethyl (9z)-Octadec-9-Enoate | Ligand Info | |||||
| Structure Description | Cryo-EM structure of Ca2+-free hsSlo1-beta4 channel complex | PDB:6V35 | ||||
| Method | Electron microscopy | Resolution | 3.50 Å | Mutation | No | [4] |
| PDB Sequence |
QRMWWAFLAS
28 SMVTFFGGLF38 IILLWRTLKY48 LWTVCWMTSV97 KDWAGVMISA107 QTLTGRVLVV 117 LVFALSIGAL127 VIYFIDSSNP137 IESCQNFYKD147 FTLQIDMAFN157 VFFLLYFGLR 167 FIAANDKLWF177 WLEVNSVVDF187 FTVPPVFVSV197 YLNRSWLGLR207 FLRALRLIQF 217 SEILQFLNIL227 KTSNSIKLVN237 LLSIFISTWL247 TAAGFIHLVE257 NSGDPWENFQ 267 NNQALTYWEC277 VYLLMVTMST287 VGYGDVYAKT297 TLGRLFMVFF307 ILGGLAMFAS 317 YVPEIIELIG327 NRKKYGGSYS337 AVSGRKHIVV347 CGHITLESVS357 NFLKDFLHKD 367 RDDVNVEIVF377 LHNISPNLEL387 EALFKRHFTQ397 VEFYQGSVLN407 PHDLARVKIE 417 SADACLILAN427 KYCADPDAED437 ASNIMRVISI447 KNYHPKIRII457 TQMLQYHNKA 467 HLLNIPSWNW477 KEGDDAICLA487 ELKLGFIAQS497 CLAQGLSTML507 ANLFSMRSFI 517 KIEEDTWQKY527 YLEGVSNEMY537 TEYLSSAFVG547 LSFPTVCELC557 FVKLKLLMIA 567 IEYKSANRES577 RILINPGNHL587 KIQEGTLGFF597 IASDAKEVKR607 AFFYCKACHD 617 DITDPKRIKK627 CGCKSNVKKY686 DSTGMFHWCA696 PKEIEKVILT706 RSEAAMTVLS 716 GHVVVCIFGD726 VSSALIGLRN736 LVMPLRASNF746 HYHELKHIVF756 VGSIEYLKRE 766 WETLHNFPKV776 SILPGTPLSR786 ADLRAVNINL796 CDMCVILSAN806 QNNIDDTSLQ 816 DKECILASLN826 IKSMQFDDTT872 GVNIPIITEL882 VNDTNVQFLD892 QDDDDDPDTE 902 LYLTQPFACG912 TAFAVSVLDS922 LMSATYFNDN932 ILTLIRTLVT942 GGATPELEAL 952 IAEENALRGG962 YSTPQTLANR972 DRCRVAQLAL982 LDGPFADLGD992 GGCYGDLFCK 1002 ALKTYNMLCF1012 GIYRLRDAHL1022 STPSQCTKRY1032 VITNPPYEFE1042 LVPTDLIFCL 1052 MQFD
|
|||||
|
|
ARG20
4.337
TRP22
3.581
TRP23
4.572
VAL31
3.667
ILE138
3.829
TRP203
3.999
PHE208
4.994
LEU212
3.752
ILE215
3.385
LEU235
4.302
ASN237
4.542
LEU239
4.724
ILE241
3.839
THR245
4.213
TRP246
4.179
THR248
4.248
PHE252
1.494
SER259
4.020
|
|||||
| Click to View More Binding Site Information of This Target with Different Ligands | ||||||
| Different Human System Profiles of Target | Top |
|---|---|
|
Human Similarity Proteins
of target is determined by comparing the sequence similarity of all human proteins with the target based on BLAST. The similarity proteins for a target are defined as the proteins with E-value < 0.005 and outside the protein families of the target.
A target that has fewer human similarity proteins outside its family is commonly regarded to possess a greater capacity to avoid undesired interactions and thus increase the possibility of finding successful drugs
(Brief Bioinform, 21: 649-662, 2020).
Human Tissue Distribution
of target is determined from a proteomics study that quantified more than 12,000 genes across 32 normal human tissues. Tissue Specificity (TS) score was used to define the enrichment of target across tissues.
The distribution of targets among different tissues or organs need to be taken into consideration when assessing the target druggability, as it is generally accepted that the wider the target distribution, the greater the concern over potential adverse effects
(Nat Rev Drug Discov, 20: 64-81, 2021).
Human Pathway Affiliation
of target is determined by the life-essential pathways provided on KEGG database. The target-affiliated pathways were defined based on the following two criteria (a) the pathways of the studied target should be life-essential for both healthy individuals and patients, and (b) the studied target should occupy an upstream position in the pathways and therefore had the ability to regulate biological function.
Targets involved in a fewer pathways have greater likelihood to be successfully developed, while those associated with more human pathways increase the chance of undesirable interferences with other human processes
(Pharmacol Rev, 58: 259-279, 2006).
Biological Network Descriptors
of target is determined based on a human protein-protein interactions (PPI) network consisting of 9,309 proteins and 52,713 PPIs, which were with a high confidence score of ≥ 0.95 collected from STRING database.
The network properties of targets based on protein-protein interactions (PPIs) have been widely adopted for the assessment of target’s druggability. Proteins with high node degree tend to have a high impact on network function through multiple interactions, while proteins with high betweenness centrality are regarded to be central for communication in interaction networks and regulate the flow of signaling information
(Front Pharmacol, 9, 1245, 2018;
Curr Opin Struct Biol. 44:134-142, 2017).
Human Similarity Proteins
Human Tissue Distribution
Human Pathway Affiliation
Biological Network Descriptors
|
|
| Protein Name | Pfam ID | Percentage of Identity (%) | E value |
|---|---|---|---|
| Potassium channel subfamily K member 5 (KCNK5) | 31.395 (27/86) | 8.67E-05 | |
| Potassium channel subfamily K member 4 (KCNK4) | 30.645 (19/62) | 4.00E-03 |
|
Note:
If a protein has TS (tissue specficity) scores at least in one tissue >= 2.5, this protein is called tissue-enriched (including tissue-enriched-but-not-specific and tissue-specific). In the plots, the vertical lines are at thresholds 2.5 and 4.
|
| KEGG Pathway | Pathway ID | Affiliated Target | Pathway Map |
|---|---|---|---|
| cGMP-PKG signaling pathway | hsa04022 | Affiliated Target |

|
| Class: Environmental Information Processing => Signal transduction | Pathway Hierarchy | ||
| Vascular smooth muscle contraction | hsa04270 | Affiliated Target |

|
| Class: Organismal Systems => Circulatory system | Pathway Hierarchy | ||
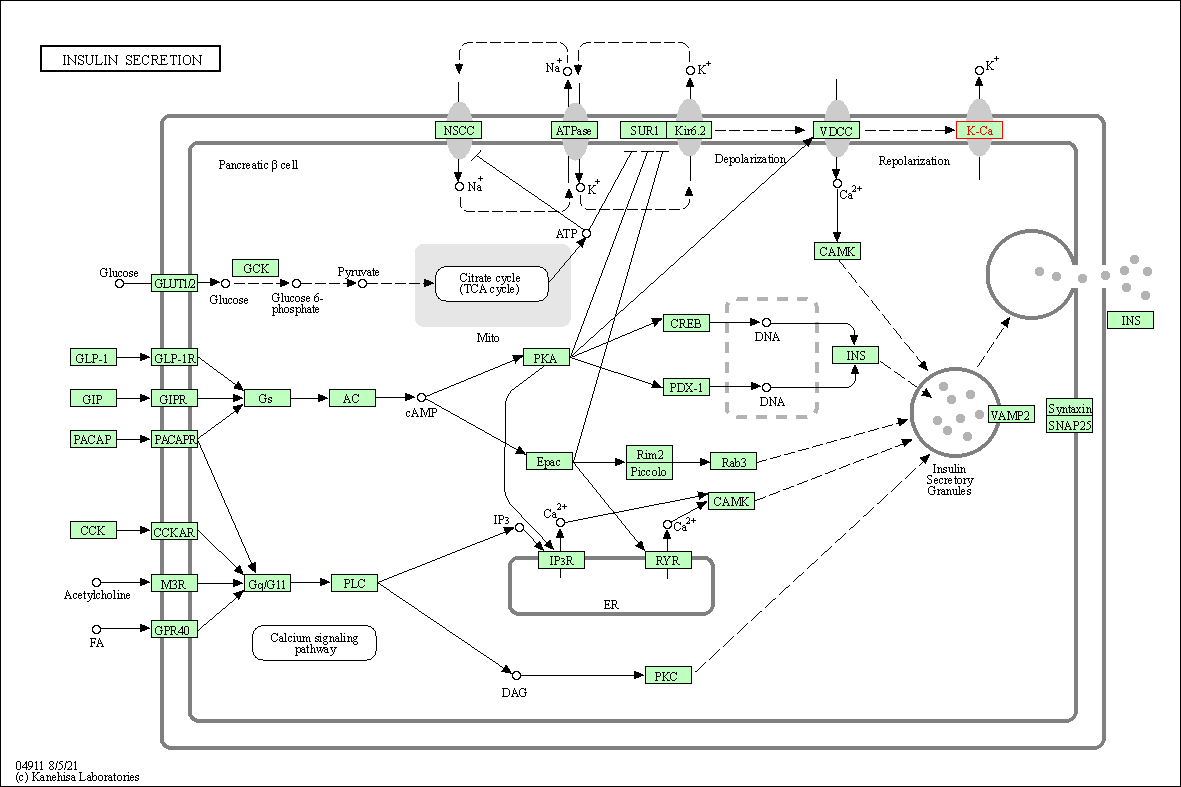
| Insulin secretion | hsa04911 | Affiliated Target |

|
| Class: Organismal Systems => Endocrine system | Pathway Hierarchy | ||
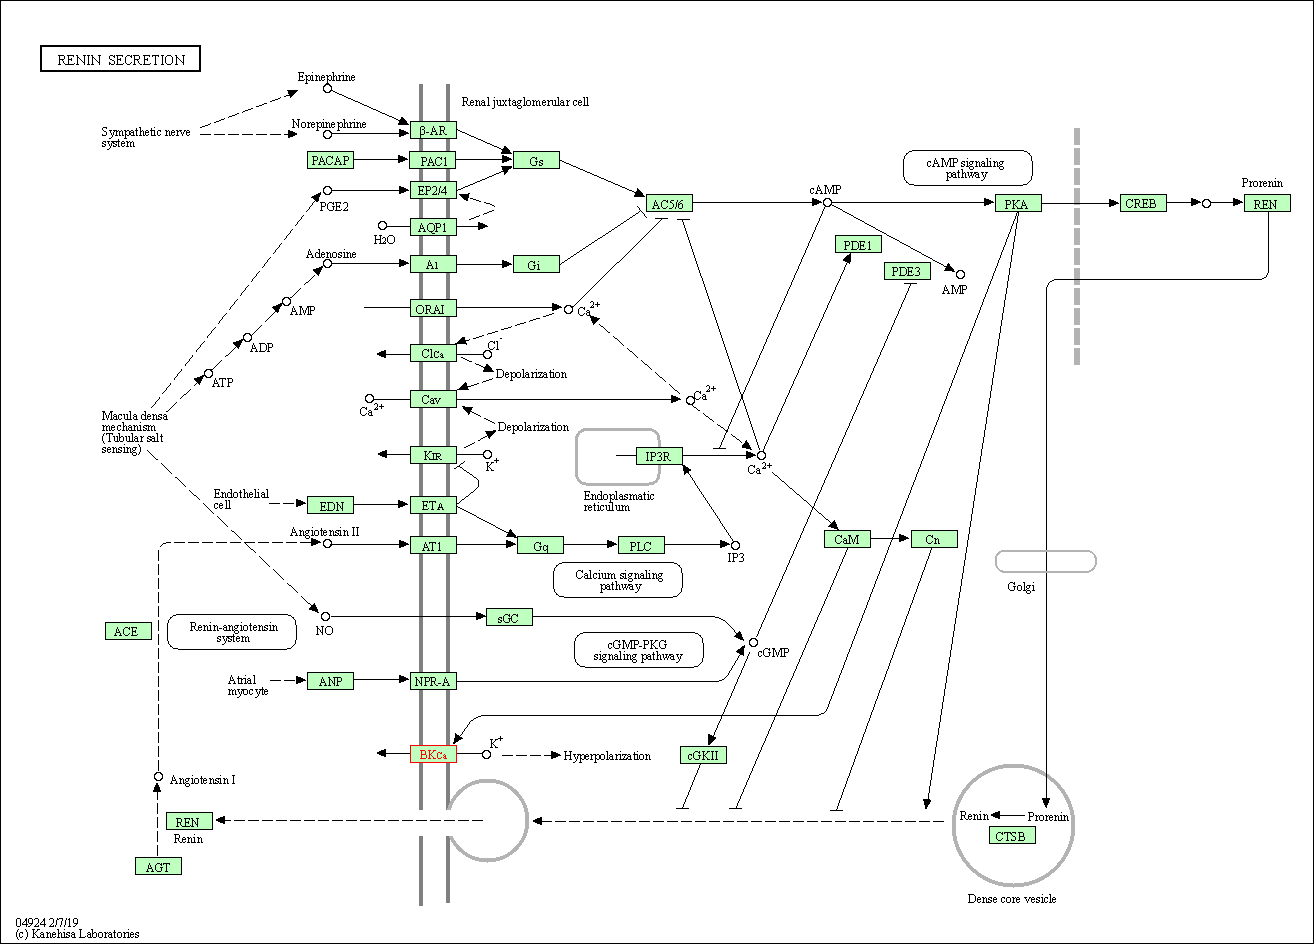
| Renin secretion | hsa04924 | Affiliated Target |

|
| Class: Organismal Systems => Endocrine system | Pathway Hierarchy | ||
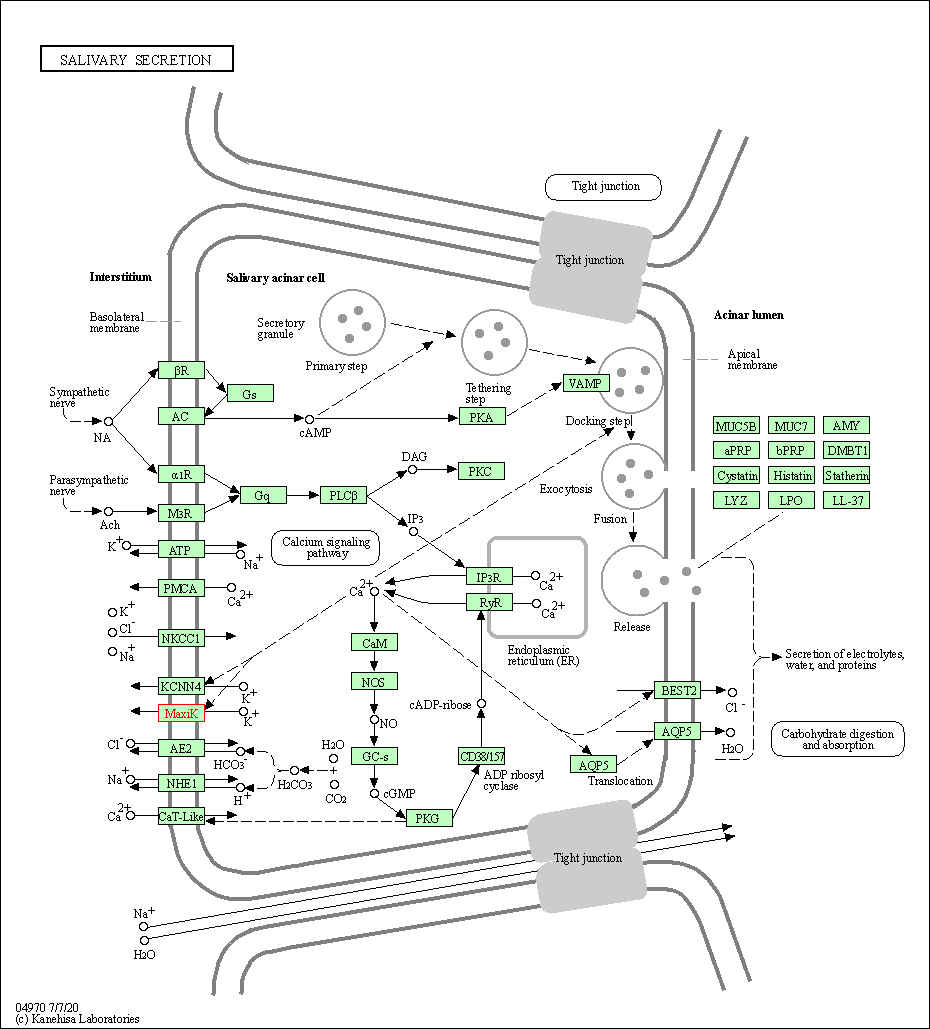
| Salivary secretion | hsa04970 | Affiliated Target |

|
| Class: Organismal Systems => Digestive system | Pathway Hierarchy | ||
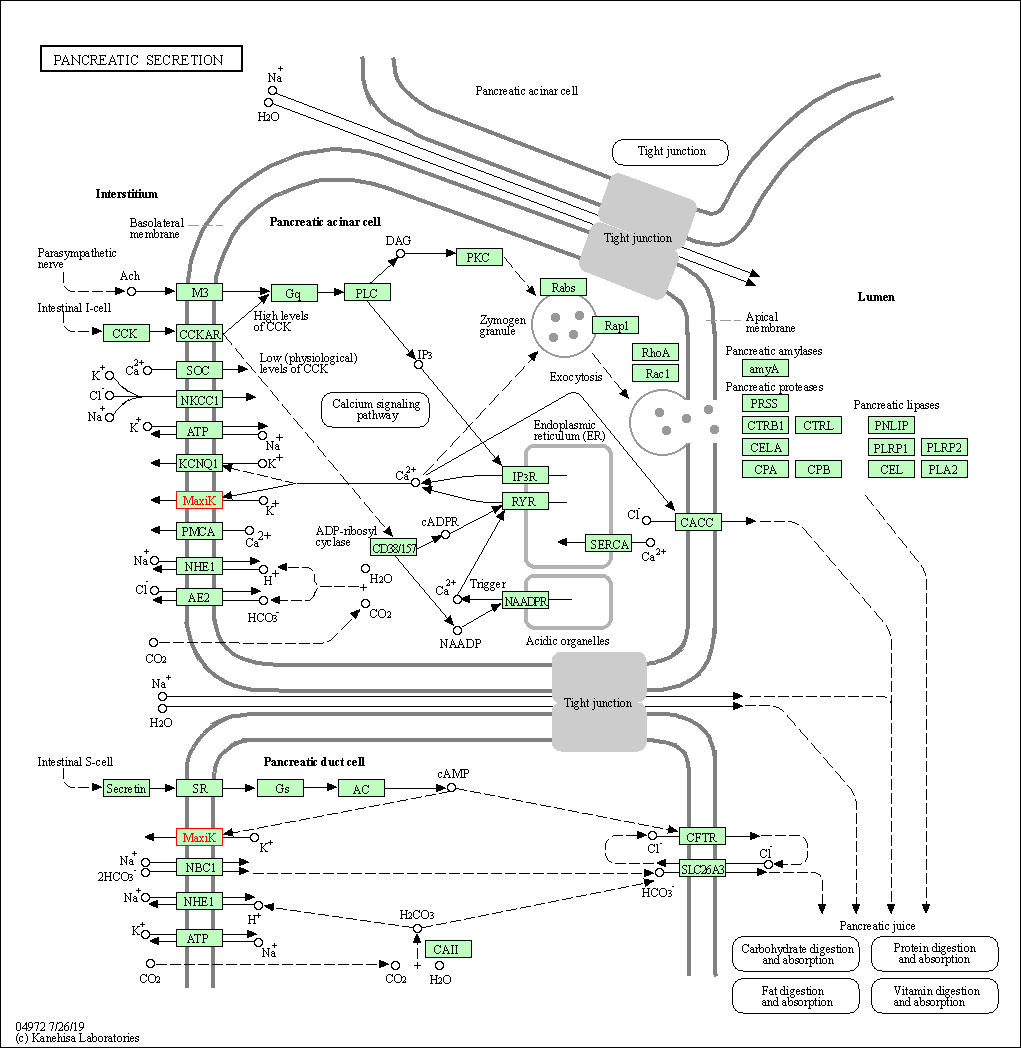
| Pancreatic secretion | hsa04972 | Affiliated Target |

|
| Class: Organismal Systems => Digestive system | Pathway Hierarchy | ||
| Click to Show/Hide the Information of Affiliated Human Pathways | |||
| Degree | 5 | Degree centrality | 5.37E-04 | Betweenness centrality | 8.10E-04 |
|---|---|---|---|---|---|
| Closeness centrality | 1.28E-01 | Radiality | 1.10E+01 | Clustering coefficient | 0.00E+00 |
| Neighborhood connectivity | 1.20E+00 | Topological coefficient | 2.00E-01 | Eccentricity | 15 |
| Download | Click to Download the Full PPI Network of This Target | ||||
| Chemical Structure based Activity Landscape of Target | Top |
|---|---|
| Target Poor or Non Binders | Top | |||||
|---|---|---|---|---|---|---|
| Target Poor or Non Binders | ||||||
| Target Regulators | Top | |||||
|---|---|---|---|---|---|---|
| Target-regulating microRNAs | ||||||
| Target Profiles in Patients | Top | |||||
|---|---|---|---|---|---|---|
| Target Expression Profile (TEP) | ||||||
| Target Affiliated Biological Pathways | Top | |||||
|---|---|---|---|---|---|---|
| KEGG Pathway | [+] 5 KEGG Pathways | + | ||||
| 1 | cGMP-PKG signaling pathway | |||||
| 2 | Vascular smooth muscle contraction | |||||
| 3 | Insulin secretion | |||||
| 4 | Salivary secretion | |||||
| 5 | Pancreatic secretion | |||||
| Reactome | [+] 1 Reactome Pathways | + | ||||
| 1 | cGMP effects | |||||
| WikiPathways | [+] 2 WikiPathways | + | ||||
| 1 | Potassium Channels | |||||
| 2 | Platelet homeostasis | |||||
| References | Top | |||||
|---|---|---|---|---|---|---|
| REF 1 | KCa1.1 channels regulate 1-integrin function and cell adhesion in rheumatoid arthritis fibroblast-like synoviocytes. FASEB J. 2017 Aug;31(8):3309-3320. | |||||
| REF 2 | ClinicalTrials.gov (NCT01722812) Cromoglicate in Psoriasis. U.S. National Institutes of Health. | |||||
| REF 3 | ClinicalTrials.gov (NCT04211831) An Exploratory Phase 2a Study Evaluating the Efficacy and Safety of URO-902 in Subjects With Overactive Bladder and Urge Urinary Incontinence. U.S.National Institutes of Health. | |||||
| REF 4 | Molecular structures of the human Slo1 K(+) channel in complex with beta4. Elife. 2019 Dec 9;8:e51409. | |||||
If You Find Any Error in Data or Bug in Web Service, Please Kindly Report It to Dr. Zhou and Dr. Zhang.

